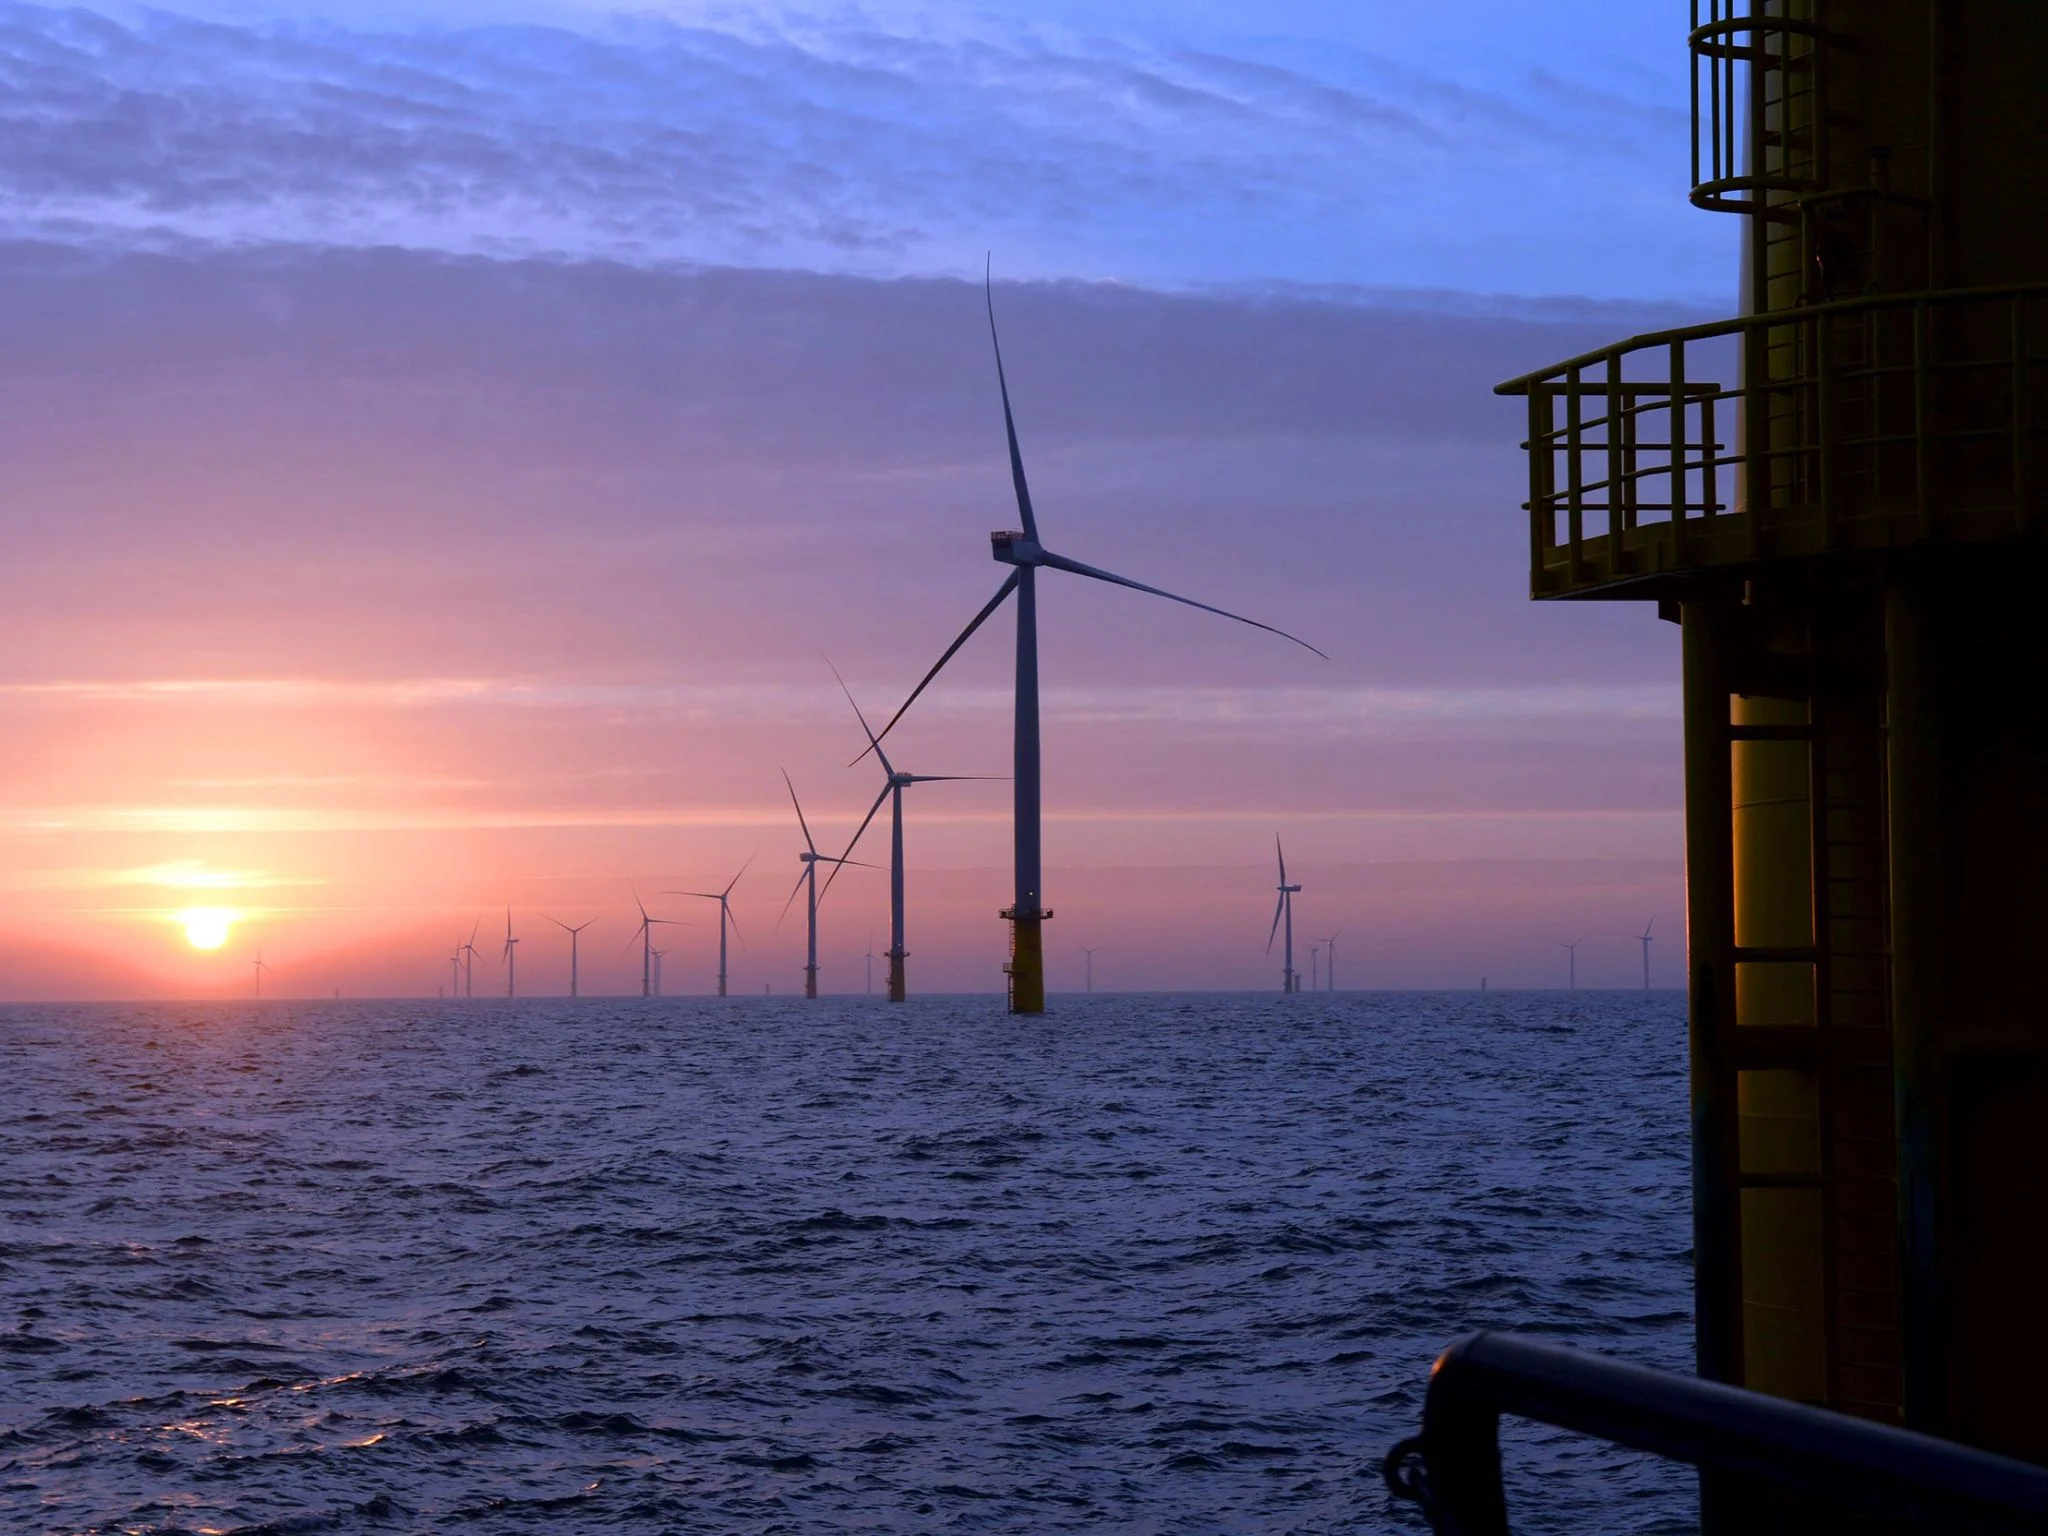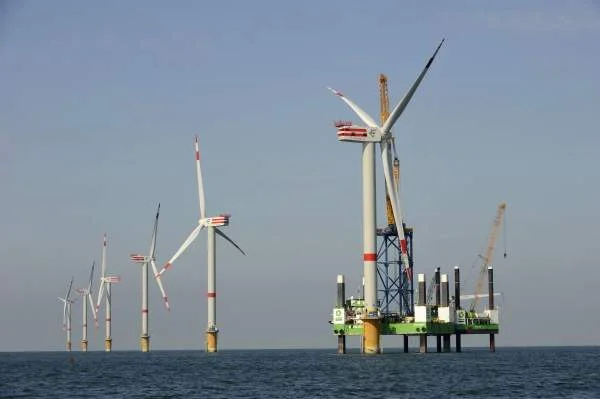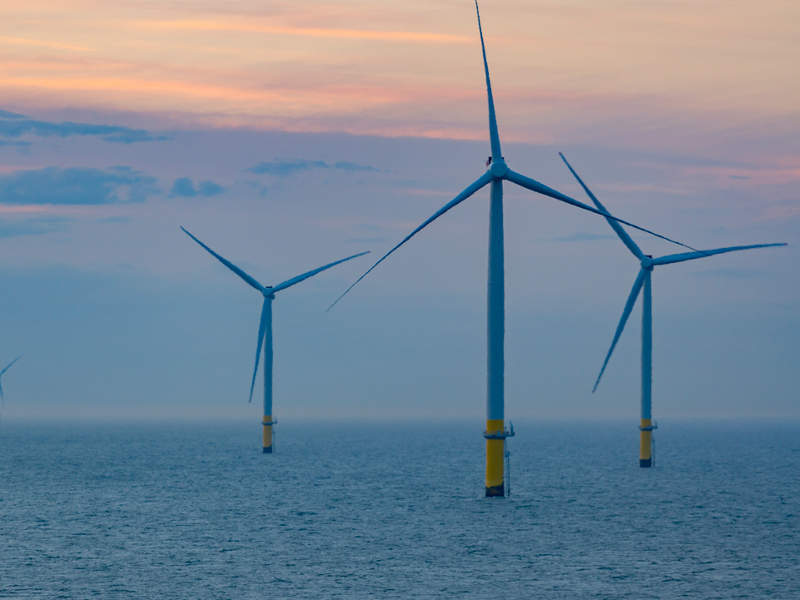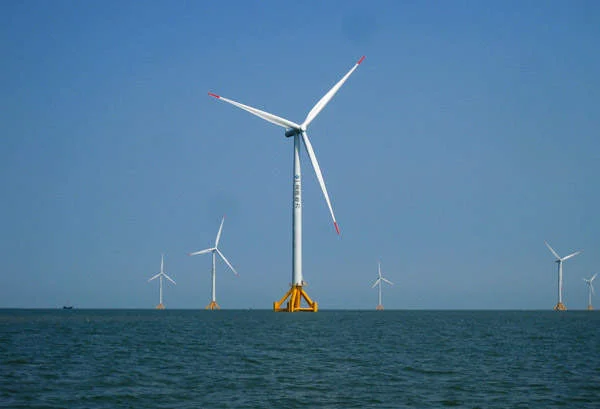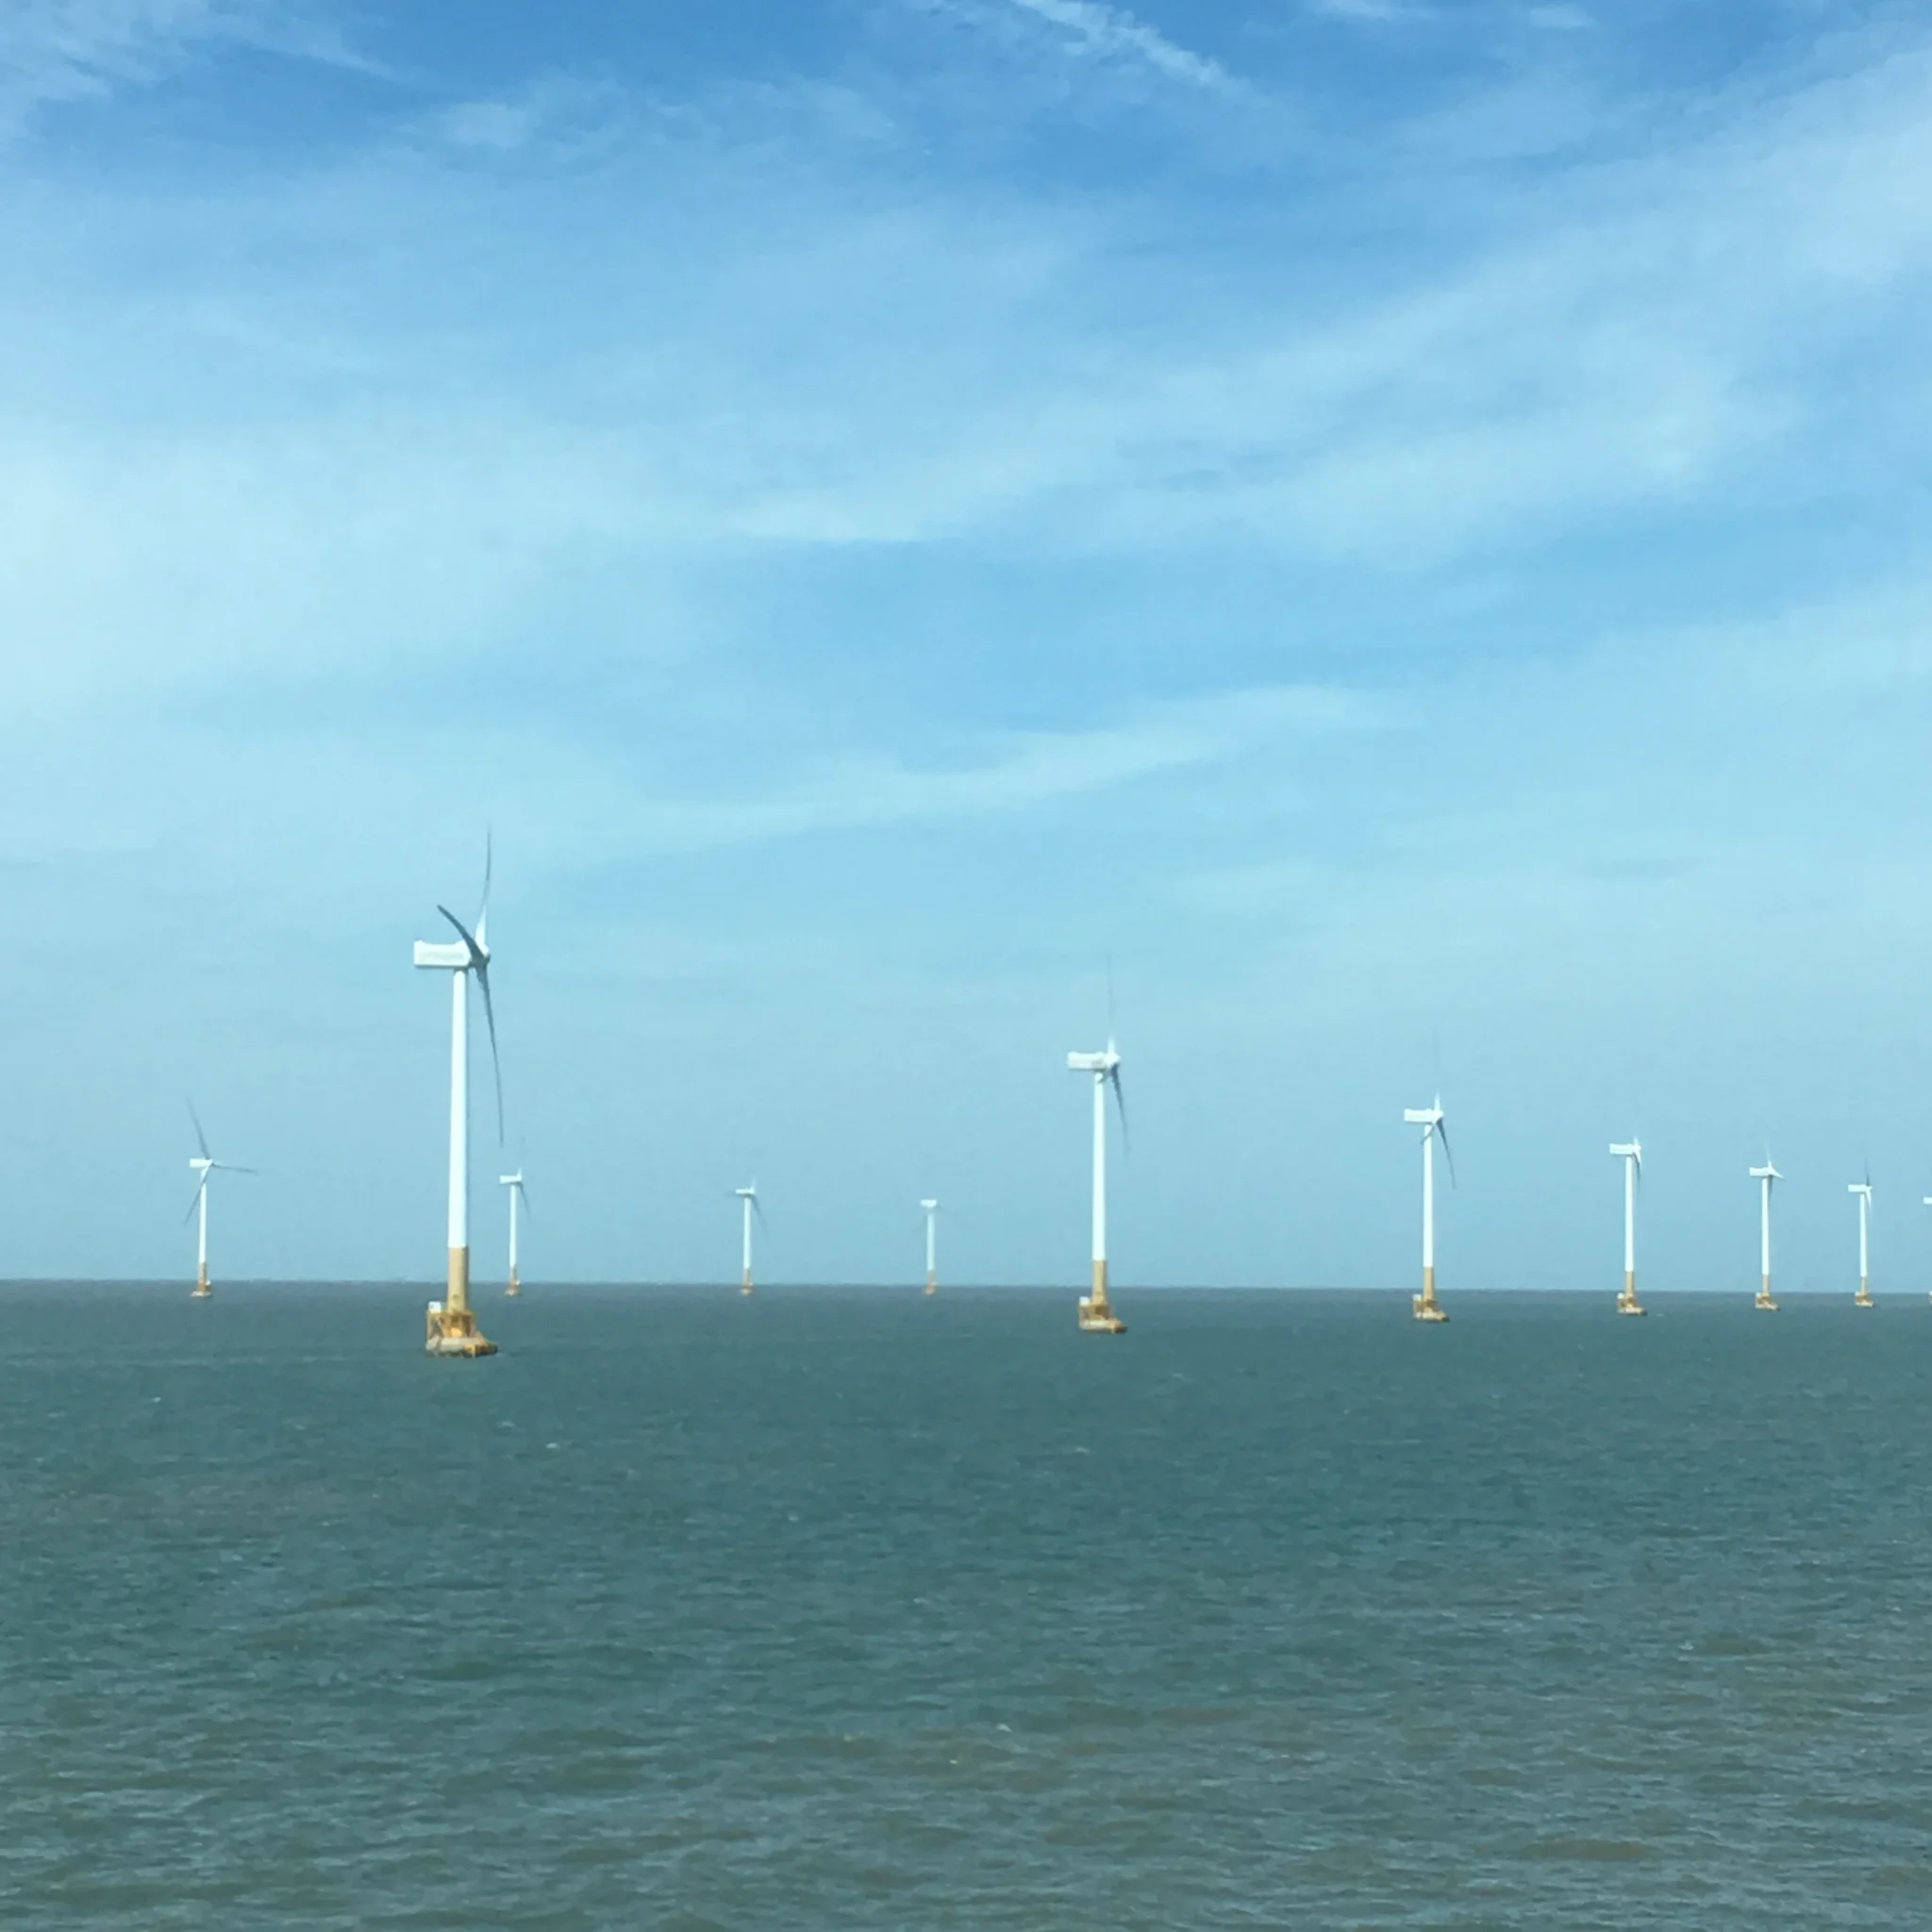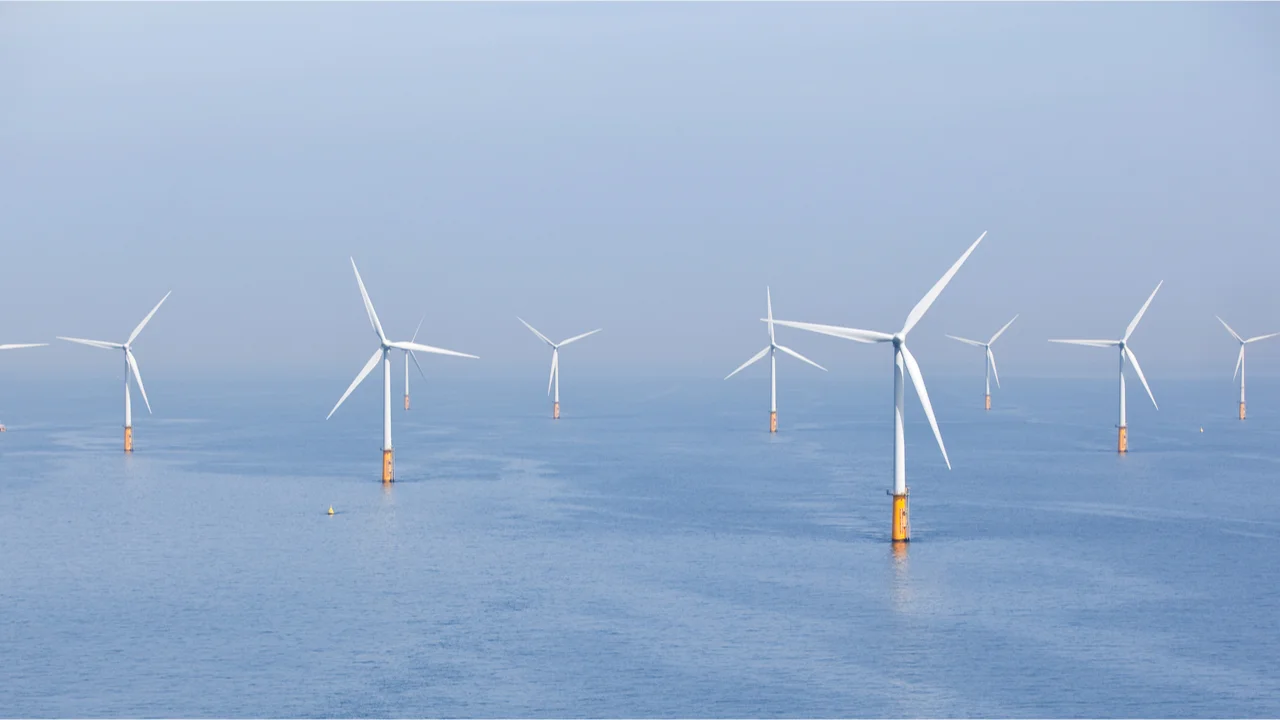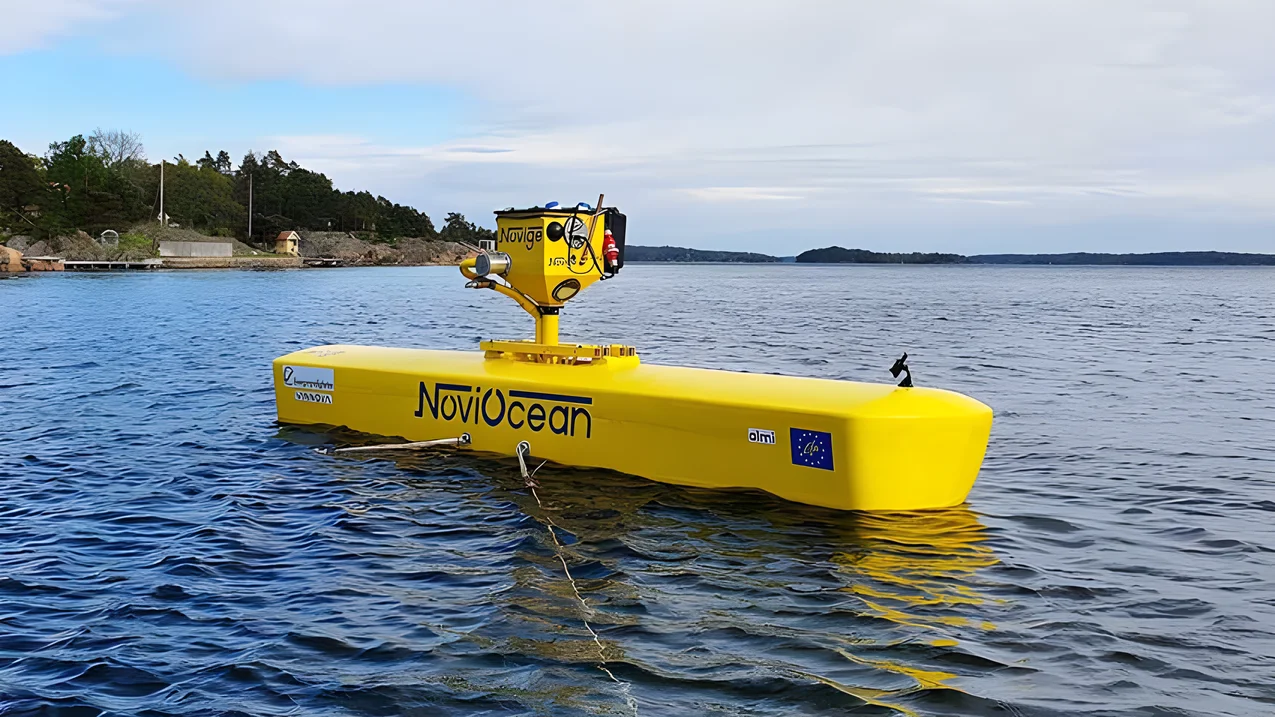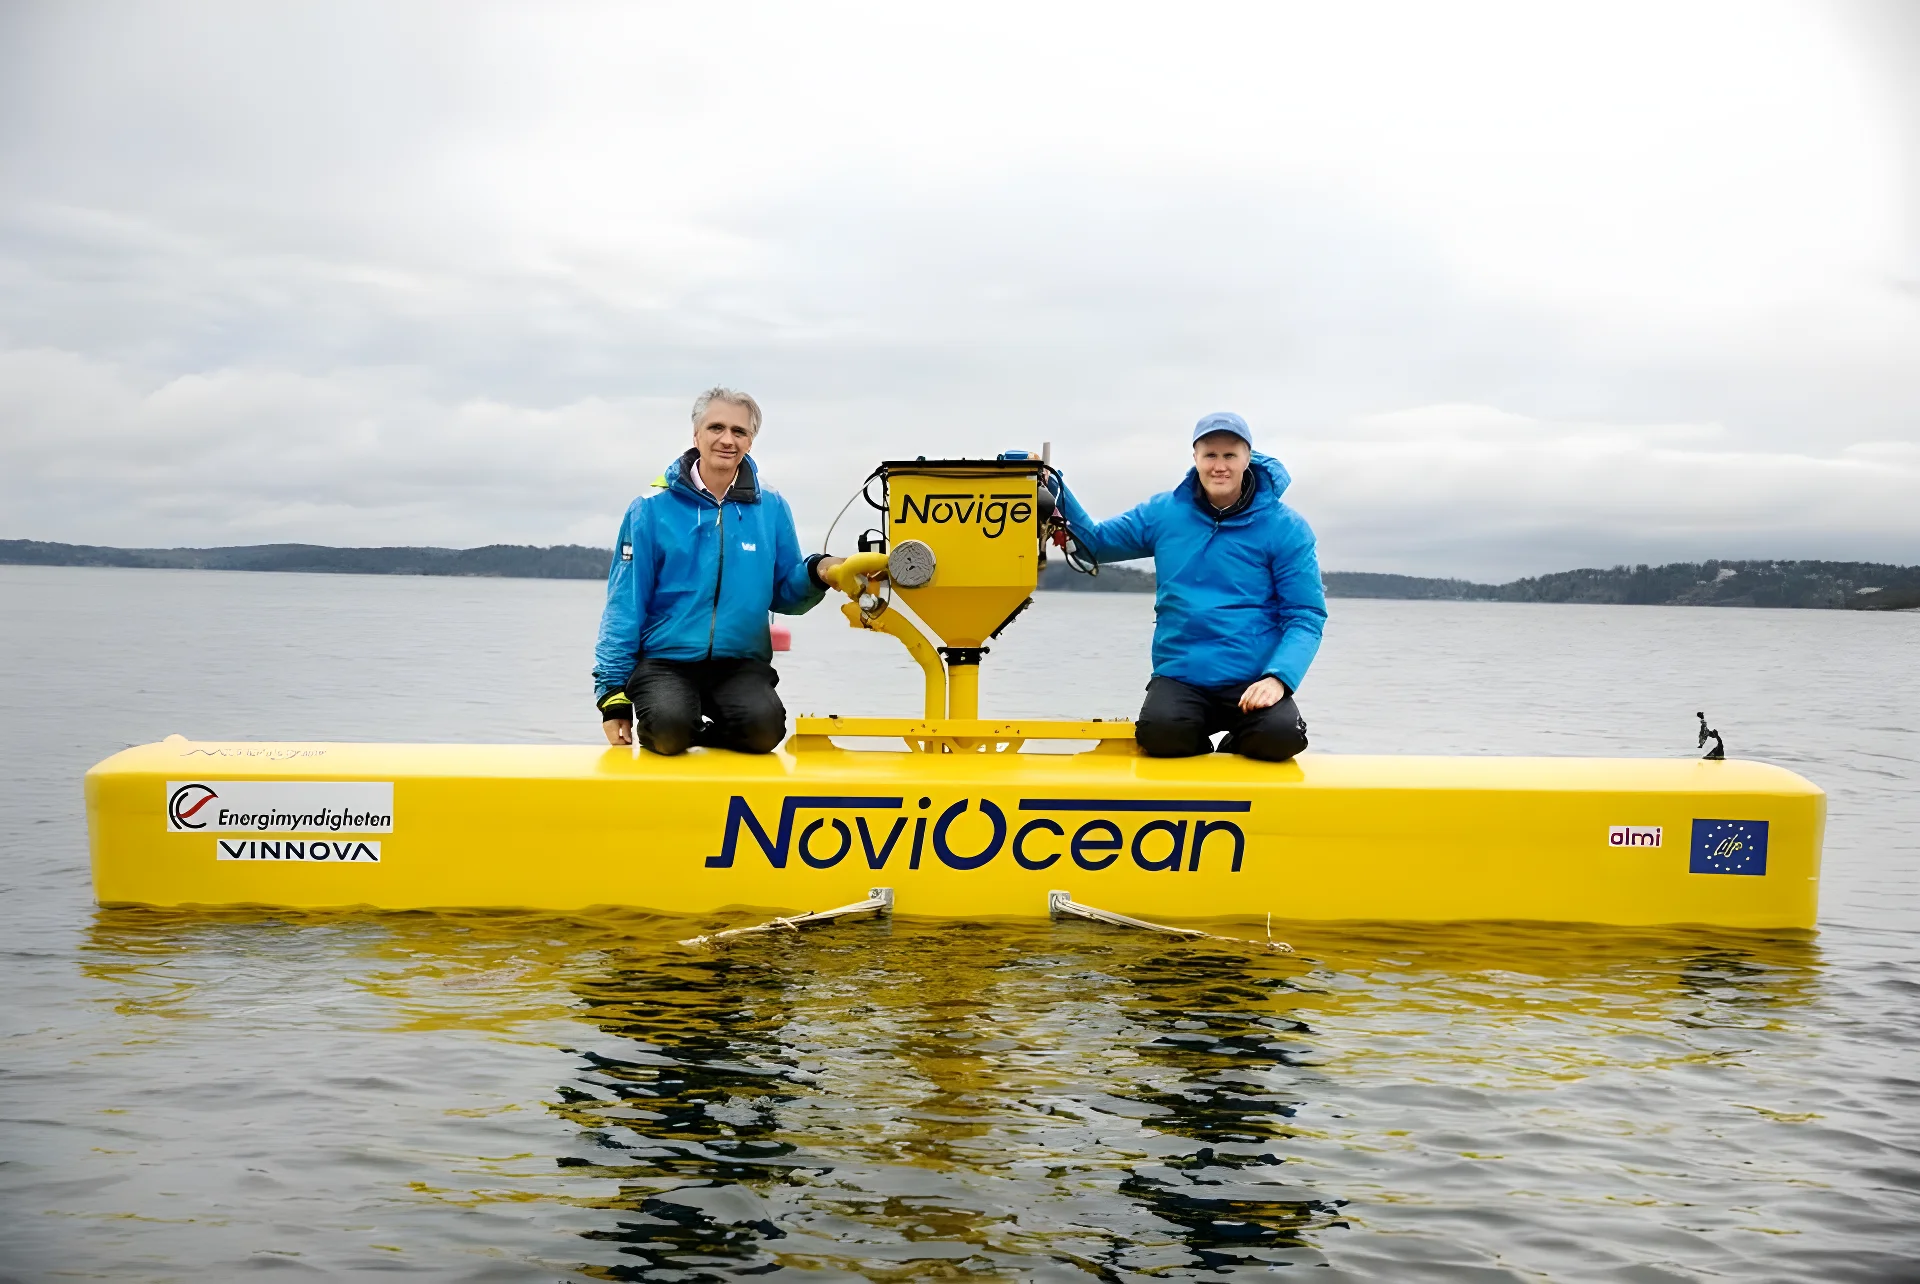
The race for clean, sustainable energy is on, and offshore wind farms are leading the charge. But what if we could unlock even more potential from these powerful installations? Enter NoviOcean 1 MW hybrid converter, a game-changer poised to revolutionize the future of offshore wind.
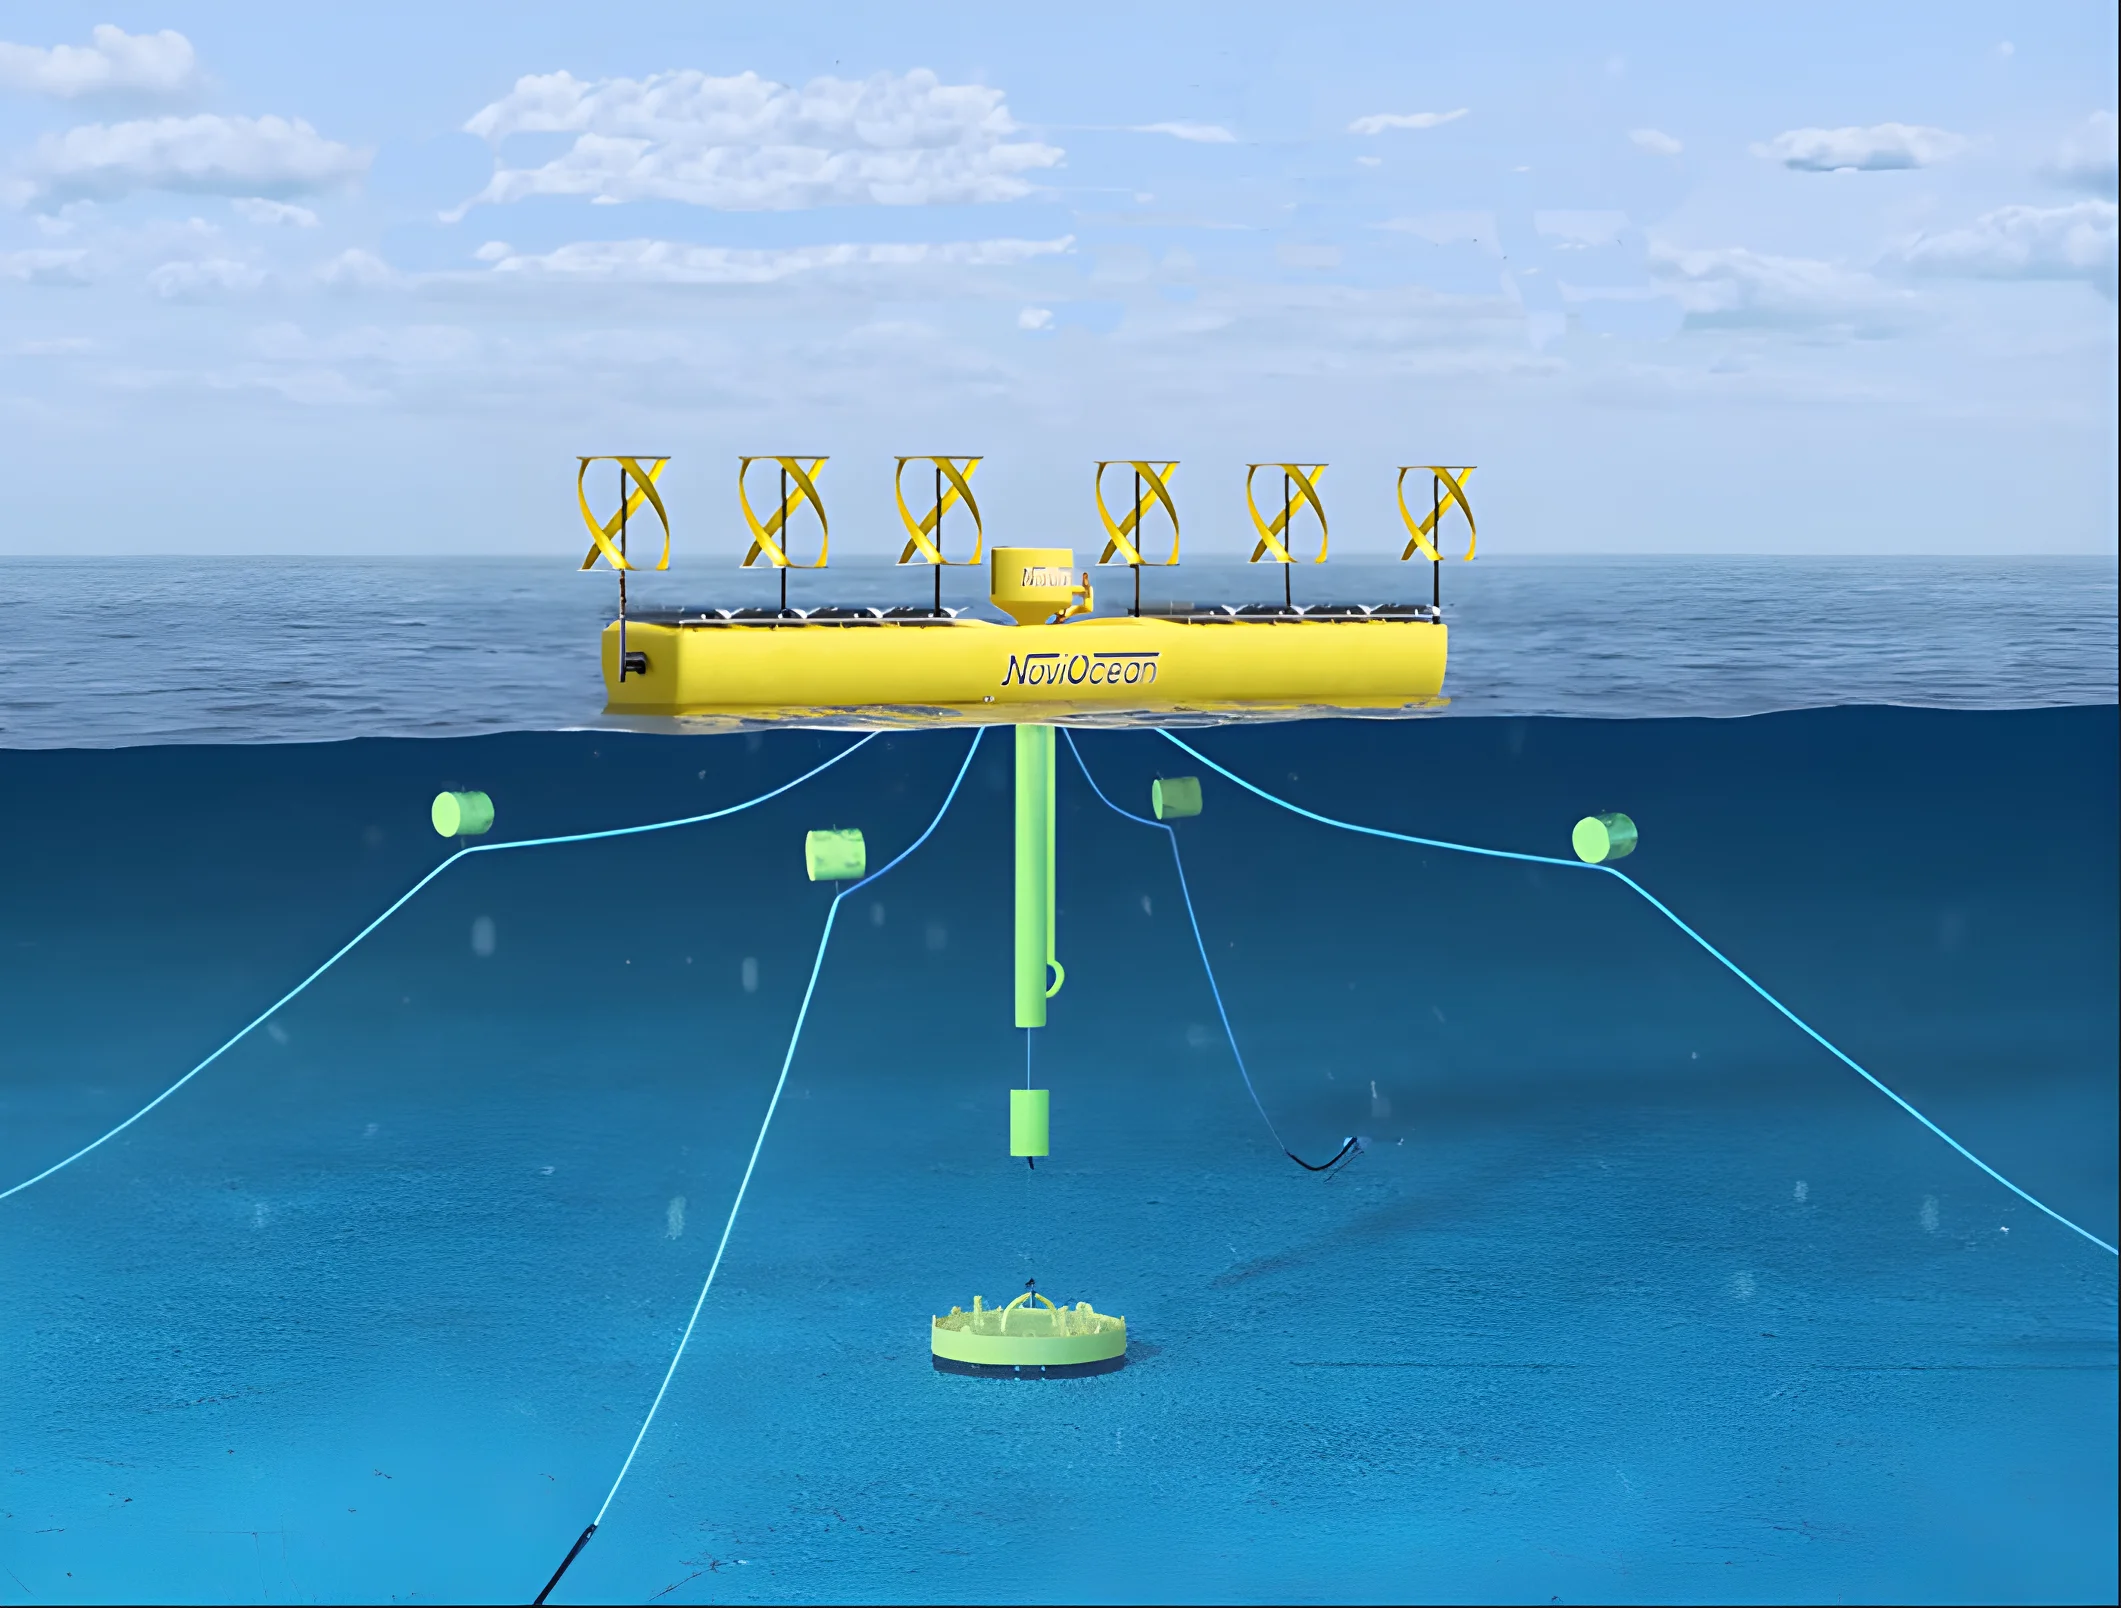
NoviOcean converter isn’t just another wind turbine. It’s a powerhouse that combines wind, wave, and solar energy into a single, integrated unit. While wind farms capture the power of the breeze, NoviOcean additionally taps into the vast, untapped wave energy potential. This trifecta of renewable sources unlocks several key advantages:
1. Smoothing the Intermittency: Wind is fickle, its strength fluctuating with the whims of nature. This variability can create challenges for grid stability. But the ocean’s waves are more consistent, their rhythmic power providing a counterpoint to wind’s fluctuations. Integrating NoviOcean’s converter into wind farms creates a synergistic effect, smoothing out energy production and ensuring more reliable, predictable power delivery.
2. Boosting Overall Output: Let’s not forget the sun! NoviOcean’s converter incorporates solar panels, harvesting the ever-present solar energy to further amplify energy production. This trifecta of renewable sources maximizes energy capture, potentially increasing overall output by up to 45% compared to wind-only farms.
3. Cost-Effectiveness: Imagine a single unit capturing the power of three! NoviOcean converter boasts a modular design, allowing for easier installation and maintenance compared to deploying separate wind, wave, and solar systems. This translates to reduced operational costs and a faster return on investment for wind farm operators.
4. Environmental Champion: As a champion of sustainability, NoviOcean converter goes beyond just clean energy production. Its low environmental impact minimizes interference with marine life and habitats. Additionally, by diversifying energy sources, the converter reduces reliance on fossil fuels, contributing significantly to combating climate change.
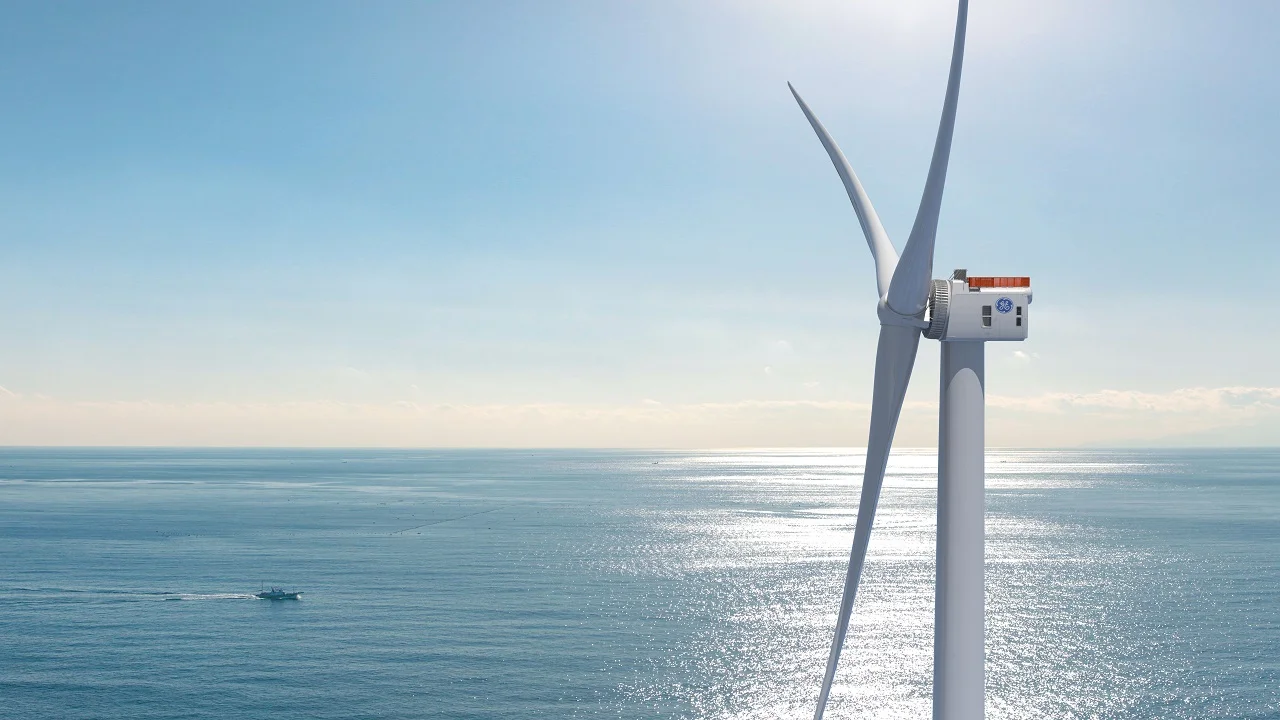
1 km² with a single 10 MW Wind Turbine: Generates 34,000 MWh/year and often faces objections due to proximity to land.
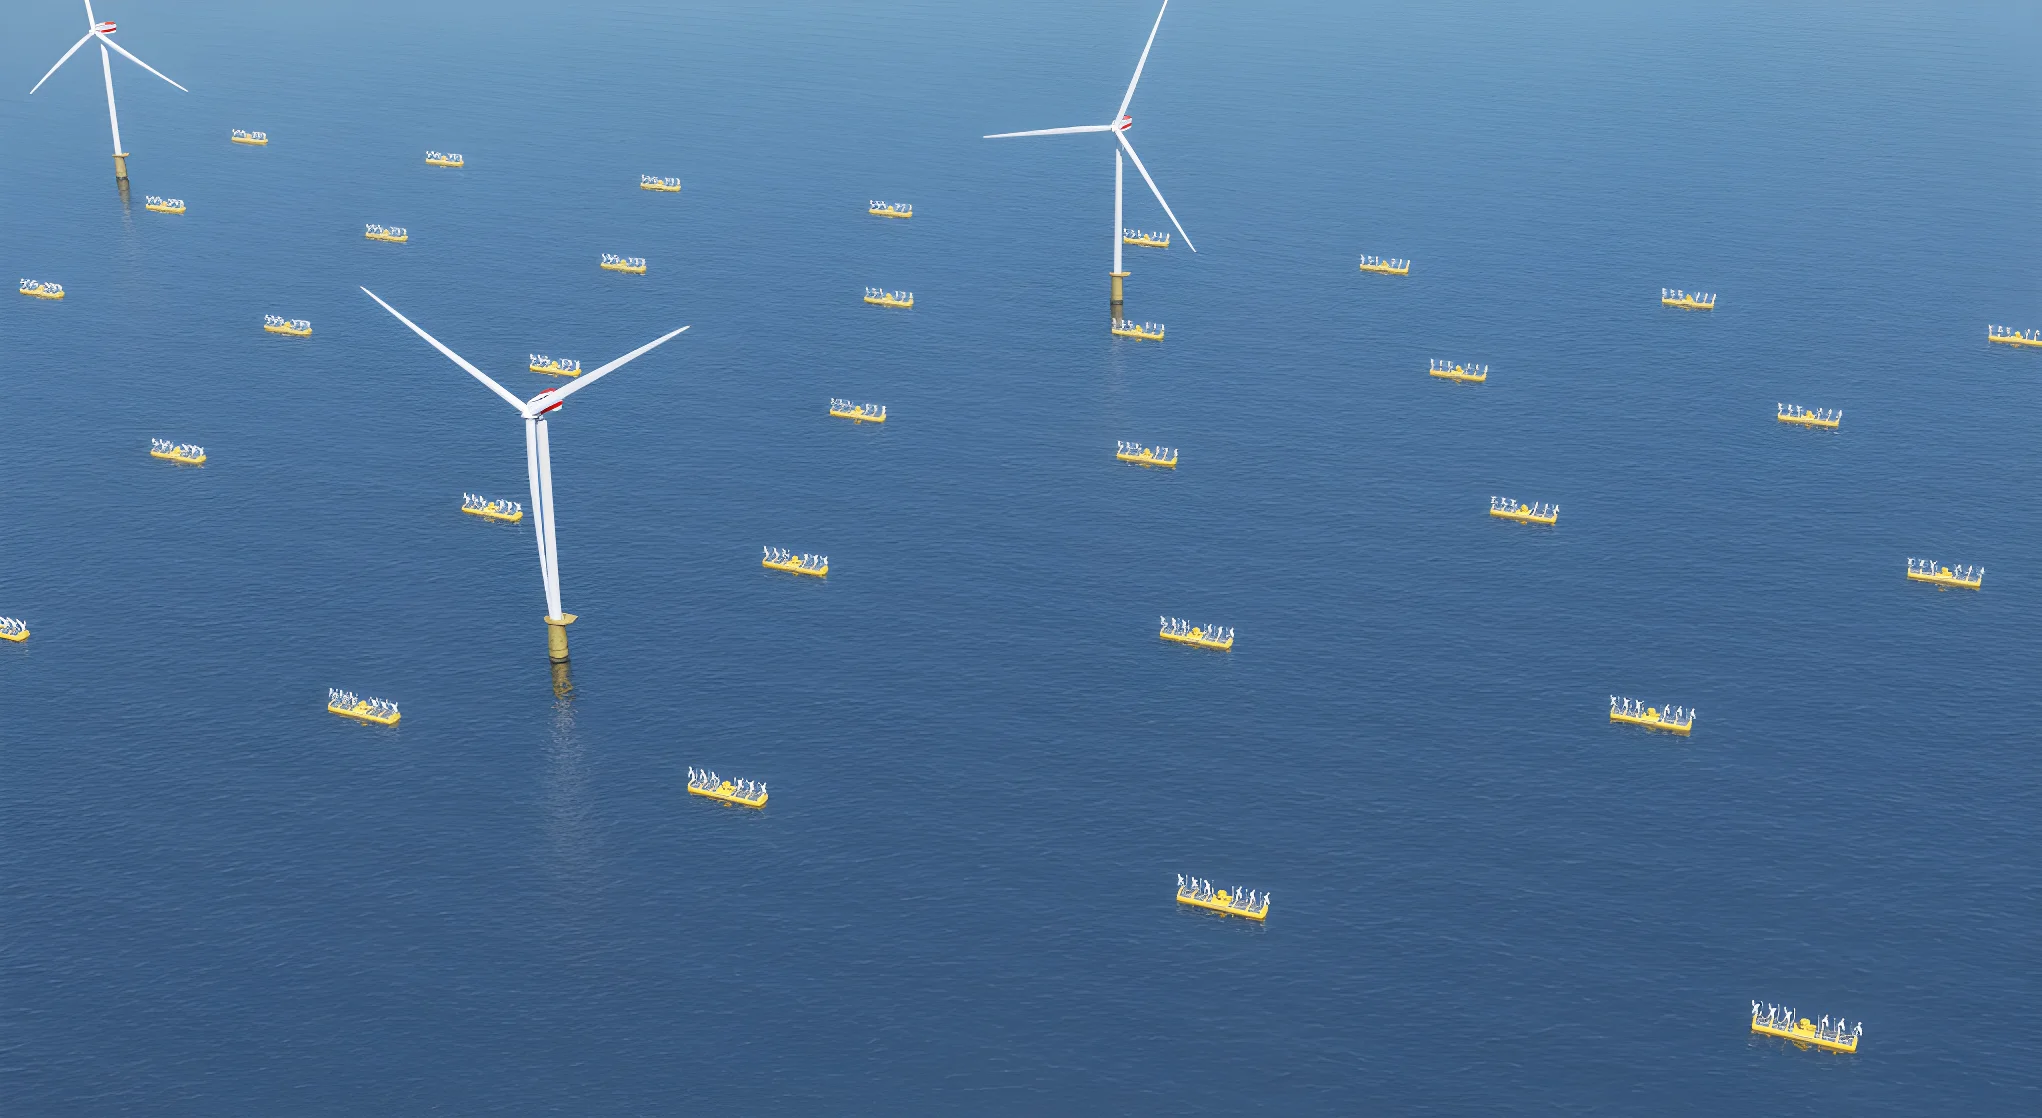
1 km² with 15 MW NoviOcean Hybrid: Generates 52,000 MWh/year, avoids 34,000 tons of CO2 emissions, and enjoys wider public acceptance due to lower visual and audible impact.
1 km² with co-located 24 MW system (10 MW wind + 15 MW NoviOcean ): Generates 86,000 MWh/year, benefits from shared infrastructure costs, and offers a vast CO2 emissions reduction potential across applicable areas.


Europe:
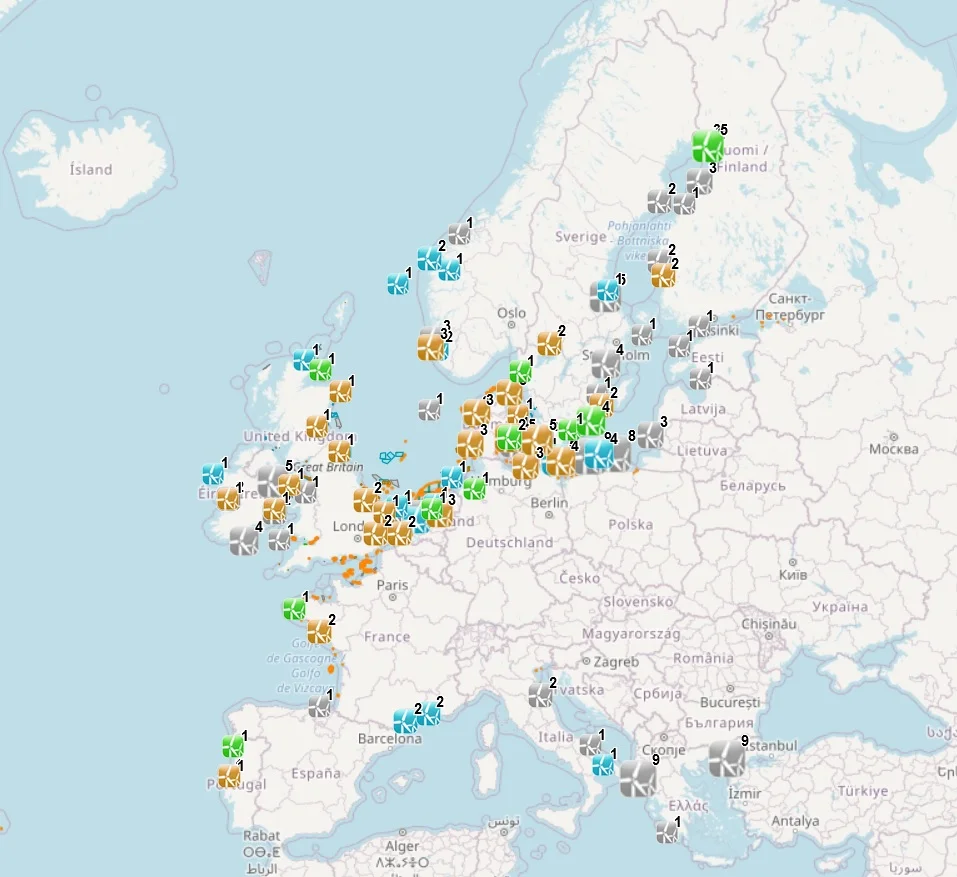
WindEurope Offshore Wind Farms Map: This map by WindEurope provides a detailed overview of operational, consented, and proposed offshore wind farms across Europe. It uses different symbols to differentiate between the project stages and allows you to filter by various criteria, including country and capacity
Location
United Kingdom
Sea Area Utilisation (km²)
389
Capacity (MW)
1,386
Production (MWh/year)
11,088
CO2 emissions avoided (Tonnes)
1.9 million
NoviOcean Co-Locations with “Hornsea Project Two“
Sea Area Utilisation (km²)
389
Capacity (MW) + NoviOcean 15 MW pre km2
1,386 + 5,800 = 7,186
Production (MWh/year)
11,088 + 46,400 = 57,488
CO2 emissions avoided (Tonnes)
1.9 +13 = 14.9 million
Location
United Kingdom
Sea Area Utilisation (km²)
407
Capacity (MW)
1,218
Production (MWh/year)
9,744
CO2 emissions avoided (Tonnes)
1.66 million
NoviOcean Co-Locations with “Hornsea Project One“
Sea Area Utilisation (km²)
407
Capacity (MW) + NoviOcean 15 MW pre km2
1,218 + 6,105 = 7,323
Production (MWh/year)
9,744 + 48,840 = 58,584
CO2 emissions avoided (Tonnes)
1.66 +13.8 = 15.46 million
Location
United Kingdom
Sea Area Utilisation (km²)
128
Capacity (MW)
1,075
Production (MWh/year)
8,600
CO2 emissions avoided (Tonnes)
1.46 million
NoviOcean Co-Locations with “The Seagreen offshore wind farm”
Sea Area Utilisation (km²)
128
Capacity (MW) + NoviOcean 15 MW pre km2
1,075 + 1,920 = 2,995
Production (MWh/year)
8,600 + 15,360 = 23,960
CO2 emissions avoided (Tonnes)
1.46 + 4.35 = 5.80 million
Location
United Kingdom
Sea Area Utilisation (km²)
255
Capacity (MW)
950
Production (MWh/year)
7,600
CO2 emissions avoided (Tonnes)
1.29 million
NoviOcean Co-Locations with “The Moray East offshore wind farm”
Sea Area Utilisation (km²)
255
Capacity (MW) + NoviOcean 15 MW pre km2
950 + 3,825 = 4,775
Production (MWh/year)
7,600 + 30,600 = 38,200
CO2 emissions avoided (Tonnes)
1.29 + 8.67 = 9.96 million
Location
Belgium
Sea Area Utilisation (km²)
33
Capacity (MW)
325
Production (MWh/year)
2,600
CO2 emissions avoided (Tonnes)
0.44 million
NoviOcean Co-Locations with “The Moray East offshore wind farm”
Sea Area Utilisation (km²)
33
Capacity (MW) + NoviOcean 15 MW pre km2
325 + 495 = 820
Production (MWh/year)
2,600 + 3,960 = 6,560
CO2 emissions avoided (Tonnes)
0.44 + 1.12 = 1.56 million
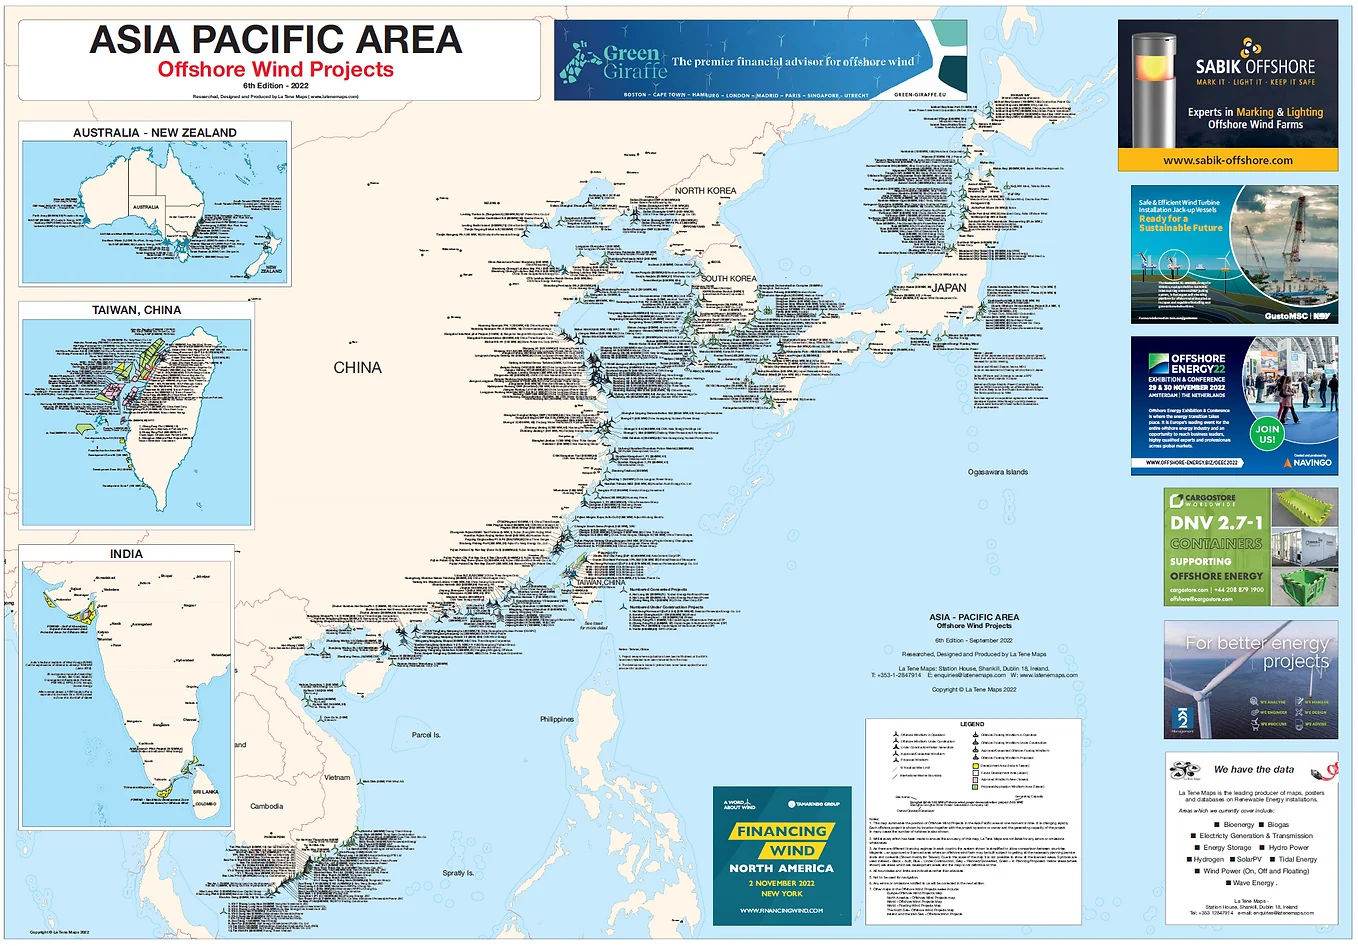
Asia :
Asia Pacific- Offshore Wind Farm Projects Map, 6th ed. September 2022: This map by Maps & Globe Specialist shows the current, planned (consented) and proposed disposition of offshore wind projects in Asia, along with developer/operator, generating capacity and number of turbines where known. While it doesn’t highlight seismic zones, it offers a comprehensive overview of projects across the region.
Location
Taiwan
Sea Area Utilisation (km²)
70
Capacity (MW)
2,880
Production (MWh/year)
23,040
CO2 emissions avoided (Tonnes)
3.89 million
NoviOcean Co-Locations with ” The Greater Changhua 1 & 2 offshore windfarm”
Sea Area Utilisation (km²)
70
Capacity (MW) + NoviOcean 15 MW pre km2
2,880 + 1,050 = 3,930
Production (MWh/year)
23,040 + 8,400 = 31,440
CO2 emissions avoided (Tonnes)
3.89 + 2.38 = 6.27 million
Location
China
Sea Area Utilisation (km²)
220
Capacity (MW)
2,000
Production (MWh/year)
16,000
CO2 emissions avoided (Tonnes)
2.7 million
NoviOcean Co-Locations with ” The Jiangsu Rudong Offshore Wind Farm”
Sea Area Utilisation (km²)
220
Capacity (MW) + NoviOcean 15 MW pre km2
2,000 + 3,300 = 5,300
Production (MWh/year)
16,000 + 26,400 = 42,400
CO2 emissions avoided (Tonnes)
2.7 + 7.48 = 10.18 million
Location
China
Sea Area Utilisation (km²)
557
Capacity (MW)
1,800
Production (MWh/year)
14,400
CO2 emissions avoided (Tonnes)
2.43 million
NoviOcean Co-Locations with ” Donghai Bridge Offshore Wind Farm”
Sea Area Utilisation (km²)
557
Capacity (MW) + NoviOcean 15 MW pre km2
1,800 + 8,355 = 10,155
Production (MWh/year)
14,400 + 66,840 = 81,240
CO2 emissions avoided (Tonnes)
2.43 + 18.8 = 21.23 million
North America :
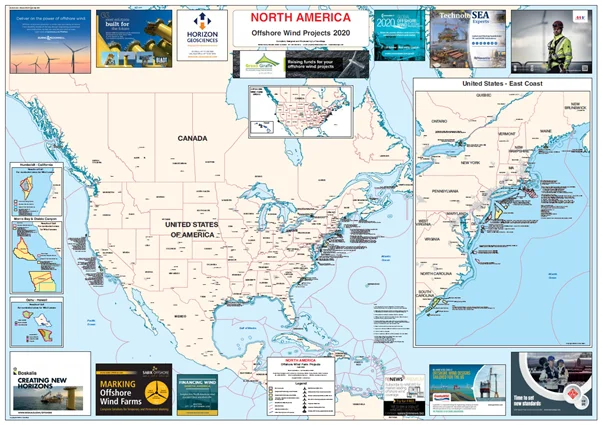
Offshore Wind Farms in North America: A Growing Powerhouse
Offshore wind energy is making a splash in North America, with its vast potential for clean and reliable electricity generation. Here’s a map showcasing the current and planned offshore wind farms across the continent.
Location
United States
Sea Area Utilisation (km²)
53
Capacity (MW)
800
Production (MWh/year)
6,400
CO2 emissions avoided (Tonnes)
1.1 million
NoviOcean Co-Locations with ” The Vineyard Wind 1 Offshore Wind Farm “
Sea Area Utilisation (km²)
53
Capacity (MW) + NoviOcean 15 MW pre km2
800 + 795 = 1,595
Production (MWh/year)
6,400 + 6,360 = 12,762
CO2 emissions avoided (Tonnes)
1.1 + 1.8 = 2.9 million
Location
United States
Sea Area Utilisation (km²)
57
Capacity (MW)
1,100
Production (MWh/year)
8,800
CO2 emissions avoided (Tonnes)
1.51 million
NoviOcean Co-Locations with ” The Ocean Wind 1 Offshore Wind Farm ”
Sea Area Utilisation (km²)
57
Capacity (MW) + NoviOcean 15 MW pre km2
1,100 + 855 = 1,955
Production (MWh/year)
8,800 + 6,840 = 15,640
CO2 emissions avoided (Tonnes)
1.51 + 1.9 = 3.41 million
1 MW Hybrid Solution
650 kW Wave, 300 kW Wind, 50 kW Solar.
(40% capacity Factor | 3.5 GWh /unit/year)
Lighter, low LCOE, more powerful – the future of clean, efficient energy
Wave energy: 5x denser than wind, 10x solar, available 24/7, highly predictable.
Since 2016, pioneering simplicity, efficiency, and sustainability in cleantech
By 2030, 0.5 GW contracted, and by 2050, 10 GW, reflecting our ambition to campture 25% of the EU’s 2050 target, worth E 30 billion in Europe alone. The global market is six times larger
Structured path: Full-scale prototype 2022, commercial phase by 2029. Cost-efficient tech, global partners, and a sustainable future. Let’s connect!