Revolutionizing Energy: NoviOcean Co-Locations with Wind Power
Maximizing Efficiency, Minimizing Objections – Doubling Output, Reducing Emissions, and Transforming the Future of Sustainable Energy
Sea Area Utilisation
Research has demonstrated that co-locating wave and wind energy will deliver a saving of 12% in the Levelized Cost of Energy for both projects. *WES_LS09_ER_Wave_
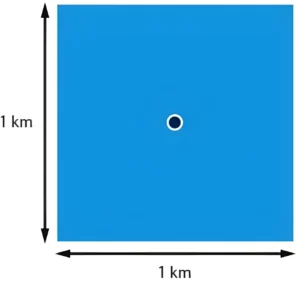
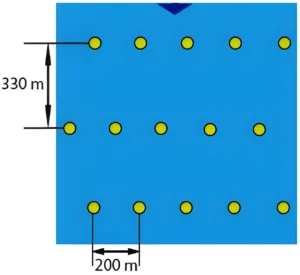
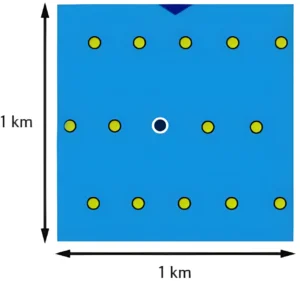
NoviOcean Value Add
Project option 1
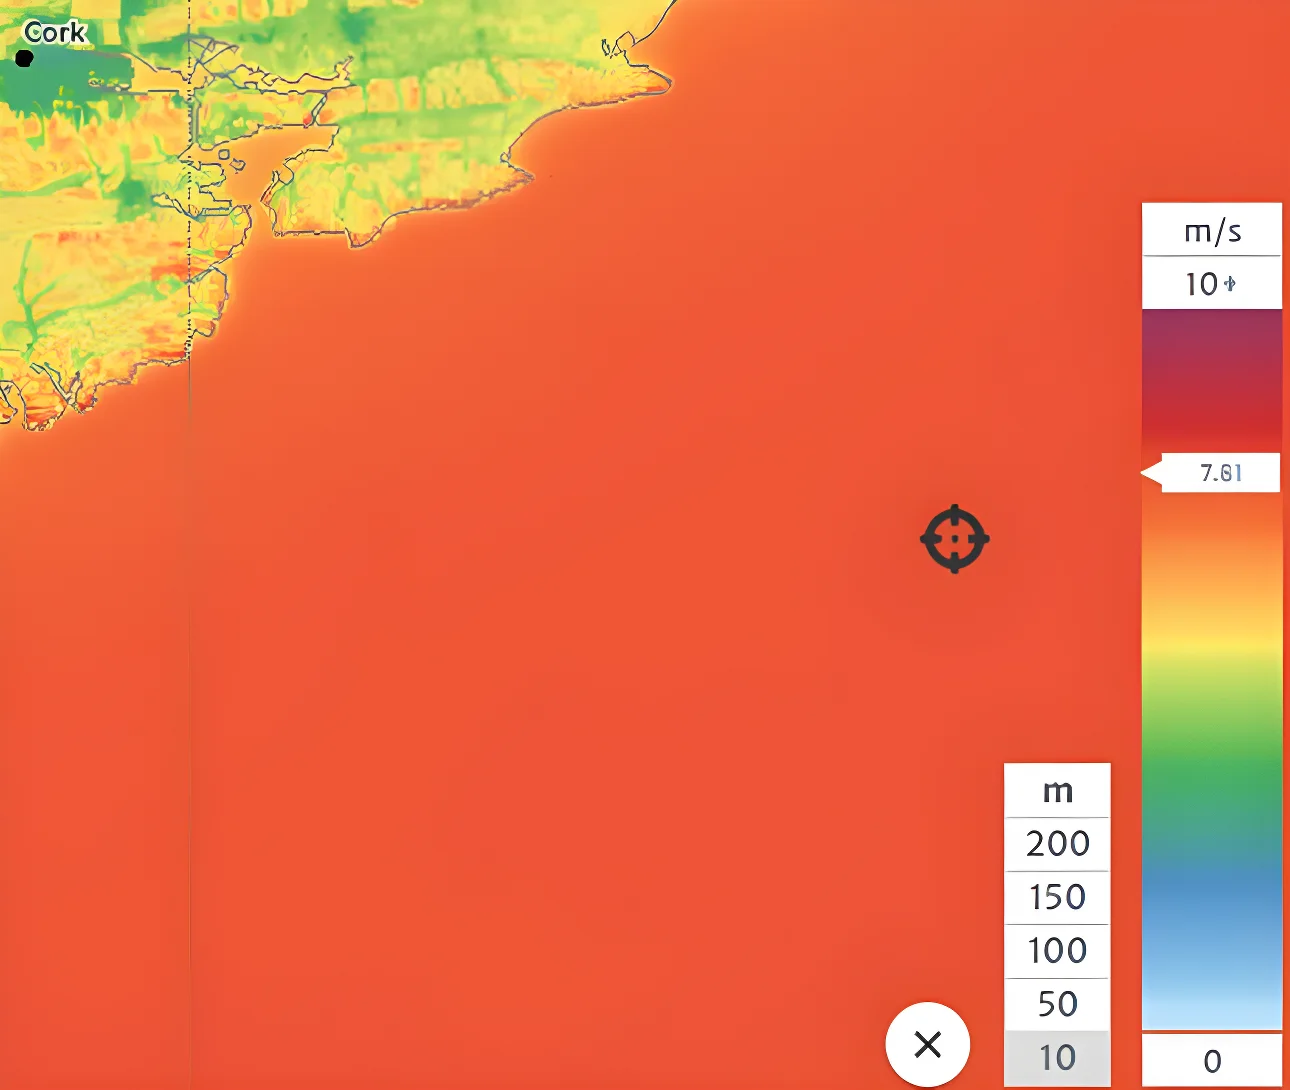
Ireland: Inis Ealga
Status : Planned
Owner : Various
Nominal Rated Power : 1 000 MW
Location : N51.61 W7.59
Depth : 77 meters
✓ Output Power Per km2 : 15 MW
(1 MW rated x 15 units per square km)
✓1.5 x (times) more than only Wind Power
✓ 2.5 x in combination of Wind and NoviOcean
* Capacity Factor at 44% : 55 000 MWh / Year
(55% Wave, 25% Wind, 9% Solar) => 6.5 MW average output
✓ More than doubling the output per square kilometre
✓ Same lease and main infrastructure / half the relative cost per MWh delivered
Details for calculations
Mean Wind Speed (m/s) at 10 meters above sea: 7.81 m/sec
Mean Wave Energy kW/m: 27 kW/m
Project option 2
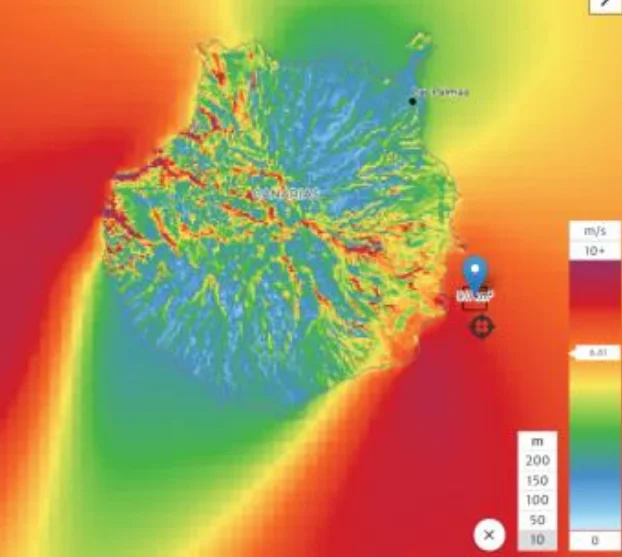
San Borondón, Canary Island, Spain
Status : Planned
Owner : Various
Nominal Rated Power : 238 MW
Location : N27.84 W15.34
Depth : 45 meters
* Output Power Per km2 : 15 MW
(1 MW rated x 15 units per square km)
✓1.5 x (times) more than only Wind Power
✓ 2.5 x in combination of Wind and NoviOcean
* Capacity Factor at 40% : 50 400 MWh / Year
(45% Wave, 33% Wind, 22% Solar) => 6.1 MW average output
✓ More than doubling the output per square kilometre
✓ If combined with offshore floating wind; same lease and main infrastructure /
half the relative cost per MWh delivered
If given 32 square km of offshore area, we alone can substitute all use of fossils on the island, 450 units
Details for calculations
Mean Wind Speed (m/s) at 10 meters above sea: 8.15 m/sec
Mean Wave Energy kW/m: 16 kW/m
Project option 3
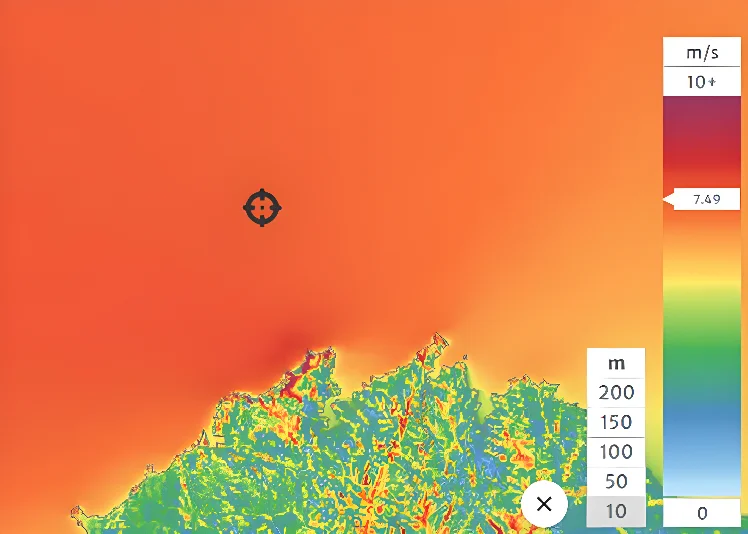
Spain: San Brandan
Status : Planned
Owner : Various
Nominal Rated Power : 490 MW
Location : N43.95 W7.99
Depth : 162 meters
* Output Power Per km2 : 15 MW
(1 MW rated x 15 units per square km)
✓ 1.5 x (times) more than only Wind Power
✓ 2.5 x in combination of Wind and NoviOcean
* Capacity Factor at 50% : 63 000 MWh / Year
(65% Wave, 25% Wind, 17% Solar) =>7.5 MW average output
✓ More than doubling the output per square kilometre
✓ Same lease and main infrastructure / half the relative cost per MWh delivered
Details for calculations
Mean Wind Speed (m/s) at 10 meters above sea: 7.49 m/sec
Mean Wave Energy kW/m: 60 kW/m
Project option 4
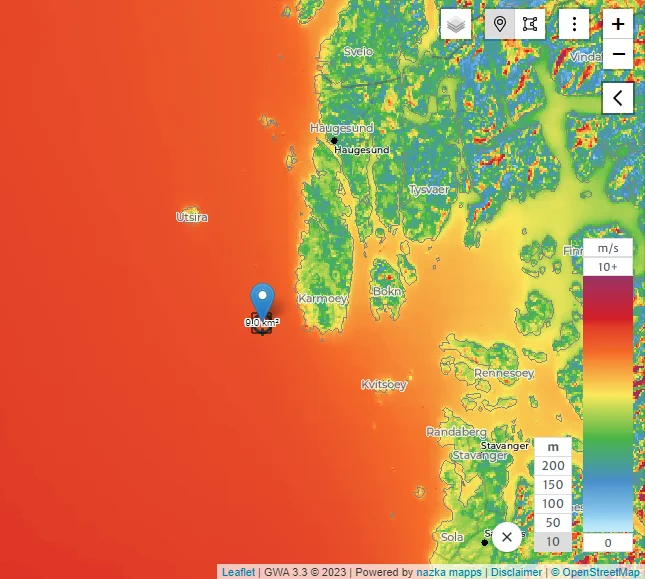
Norway: MET Centre Karmoy Floating
Status : Planned
Owner : Various
Nominal Rated Power : 10 MW
Location : N59.156 E5.078
Depth : 165 meters
* Output Power Per km2 : 15 MW
(1 MW rated x 15 units per square km)
✓ 1.5 x (times) more than only Wind Power
✓ 2.5 x in combination of Wind and NoviOcean
* Capacity Factor at 50% : 63 000 MWh / Year
(45% Wave, 45% Wind, 9% Solar) =>6.48 MW average output
✓ More than doubling the output per square kilometre
✓ Same lease and main infrastructure / half the relative cost per MWh delivered
Details for calculations
Mean Wind Speed (m/s) at 10 meters above sea: 9.45 m/sec
Mean Wave Energy kW/m: 25 kW/m
Project option 5
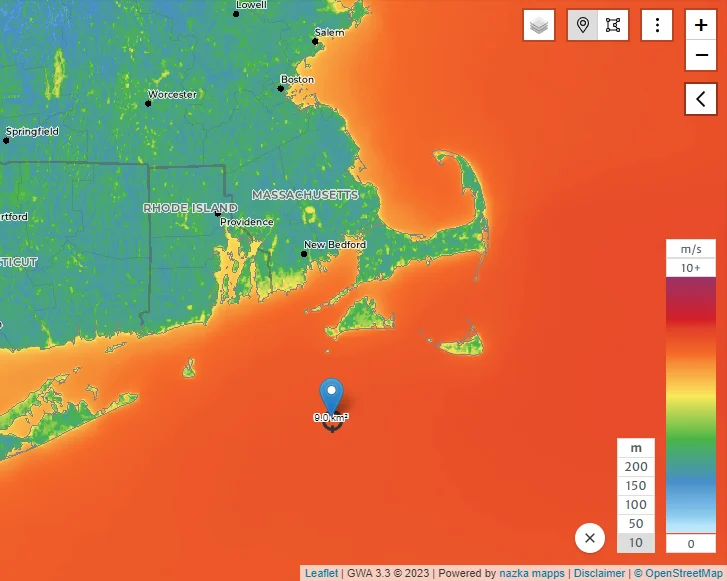
USA: Revolution Wind 2
Status : Planned
Owner : Various
Nominal Rated Power : 884 MW
Location : : N40.97 W70.79
Depth : 50 meters
* Output Power Per km2 : 15 MW
(1 MW rated x 15 units per square km)
✓ 1.5 x (times) more than only Wind Power
✓ 2.5 x in combination of Wind and NoviOcean
* Capacity Factor at 35% : 44 100 MWh / Year
(39% Wave, 30% Wind, 16% Solar) =>5.25 MW average output
✓ More than doubling the output per square kilometre
✓ Same lease and main infrastructure / half the relative cost per MWh delivered
Details for calculations
Mean Wind Speed (m/s) at 10 meters above sea: 7.5 m/sec
Mean Wave Energy kW/m: 20 kW/m
Project option 6
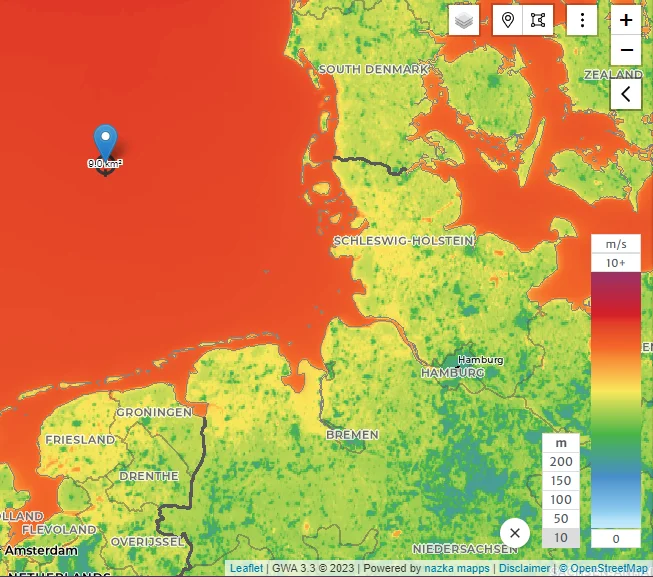
Germany N-12.2
Status : Planned
Owner : Various
Nominal Rated Power : 2 000 MW
Location : : N54.87 E6.12
Depth : 39 meters
* Output Power Per km2 : 15 MW
(1 MW rated x 15 units per square km)
✓ 1.5 x (times) more than only Wind Power
✓ 2.5 x in combination of Wind and NoviOcean
* Capacity Factor at 34% : 44 700 MWh / Year
(45% Wave, 25% Wind, 11% Solar) =>5.2 MW average output
✓ More than doubling the output per square kilometre
✓ Same lease and main infrastructure / half the relative cost per MWh delivered
Details for calculations
Mean Wind Speed (m/s) at 10 meters above sea: 7.91m/sec
Mean Wave Energy kW/m: 19 kW/m
Project option 7
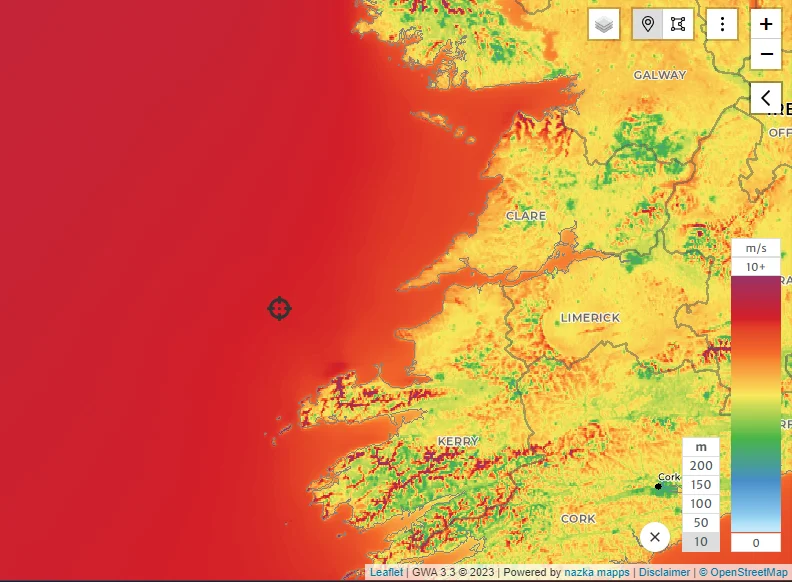
Moneypoint Offshore Two, Ireland West Coast
Status : Planned
Owner : Various
Nominal Rated Power : 500 – 4000 MW
Location : 52°30’00.0″N 10°34’48.0″W
Depth : 77 meters
✓ Output Power Per km2 : 15 MW
(1 MW rated x 15 units per square km)
✓1.5 x (times) more than only Wind Power
✓ 2.5 x in combination of Wind and NoviOcean
* Capacity Factor at 67% : 84 000 MWh / Year
(61% Wave, 80% Wind, 9% Solar) => 10.05 MW average output
✓ More than doubling the output per square kilometer
✓ Same lease and main infrastructure / half the relative cost per MWh delivered
Details for calculations
Mean Wind Speed (m/s) at 10 meters above sea: 10.47 m/sec
Mean Wave Energy kW/m: 41 kW/m
Project option 8
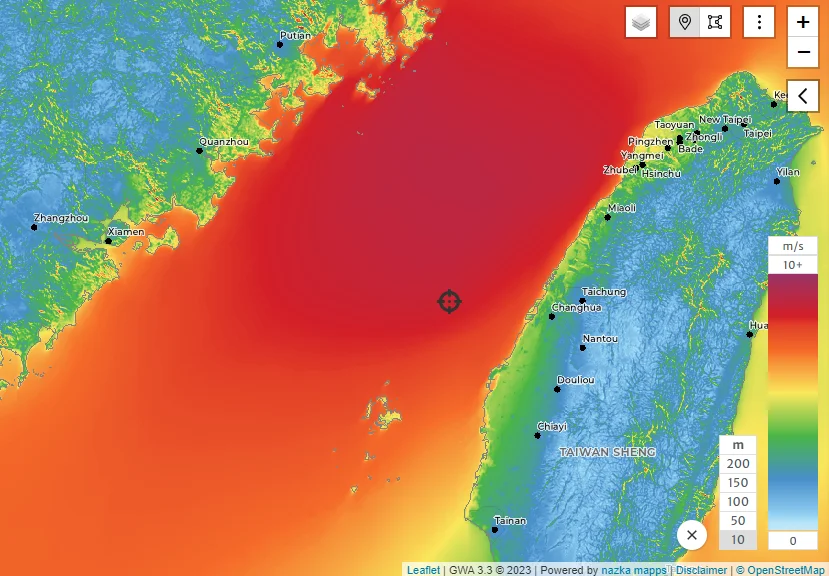
Taiwan: Greater Changhua 1 - South East
Status : Planned
Owner : Various
Nominal Rated Power : 605,2 MW
Location : N24.15 E119.95
Depth : 40 meters
✓ Output Power Per km2 : 15 MW
(1 MW rated x 15 units per square km)
✓1.5 x (times) more than only Wind Power
✓ 2.5 x in combination of Wind and NoviOcean
* Capacity Factor at 46% : 58 000 MWh / Year
(36% Wave, 75% Wind, 20% Solar) => 6.9 MW average output
✓ More than doubling the output per square kilometer
✓ Same lease and main infrastructure / half the relative cost per MWh delivered
Details for calculations
Mean Wind Speed (m/s) at 10 meters above sea: 8.53 m/sec
Mean Wave Energy kW/m: 18 kW/m
F.A.Q.
NoviOcean’s innovative Hybrid Energy Converter (NHEC) harnesses the combined power of wave, wind, and solar energy. This groundbreaking technology delivers efficient and cost-effective renewable energy, paving the way for a sustainable future.
NoviOcean HEC delivers double the power output per sea area compared to wind power. Its hybrid design (wave, wind, solar) and efficient use of infrastructure lead to a lower Levelized Cost of Energy (LCOE) in early evolution.
Noviocean HEC is easy to produce, install, and maintain due to its modular design and well-proven parts. It boasts a low environmental footprint and superior power-to-weight ratio compared to offshore wind.
NoviOcean offers competitive development costs, with LCOE reaching €100/MWh after only 100 units deployed, then lower. Investment benefits include attractive incentive programs, expected high profits, participation in a meaningful and scaleable clean energy solution, and not the least, extremely positive marketing effects for partners and users.
NoviOcean is in Stage 4 (TRL 7), developing a 1:1 scale pilot to demonstrate real-world performance and pave the way for commercial deployment.
NoviOcean aims to deliver stable ocean energy at a lower cost than offshore wind and secure 0.5 GW of contracted capacity by 2030.
NoviOcean envisions having 10 GW deployed by 2050, capturing 25% of the EU's 2050 target and generating €30 billion in sales within Europe alone. The global market potential is three times larger.
