
Featured application
Remote islands and coastal communities
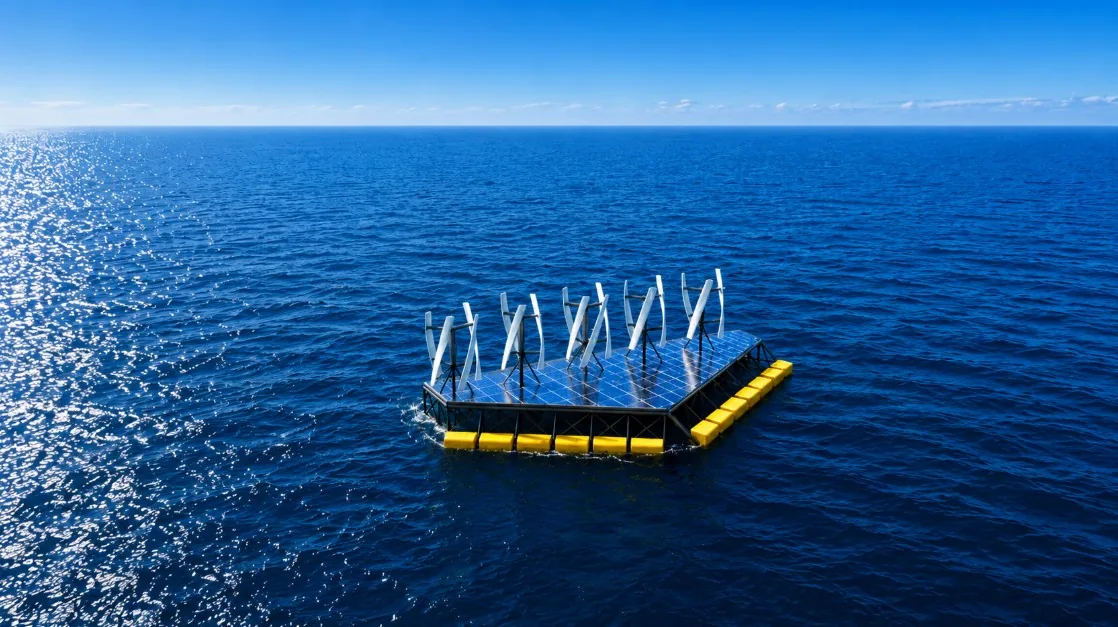
Island electricity is imported, expensive and exposed to weather no one controls. A NoviOcean platform generates wave, wind and solar power offshore — one structure, one mooring, one cable, and nothing built on land.
The customer problem
High diesel costs, energy security, constrained grids and limited land.
Four pressures, and they compound. An island buys fuel it cannot produce, holds spare generation against the days it cannot be delivered, runs a network built around one or two central stations, and competes for every hectare of flat ground it has. Any solution that solves one of the four by worsening another is not a solution.
Fuel is paid for twice
An island pays the commodity price of diesel and then pays again to move it — freight, handling, storage and losses. Both parts are set far away and move without warning, so the cost of a kilowatt-hour is decided somewhere the island has no vote.
Reserve held for the days nothing arrives
Weather closes ports and delays tankers. Utilities therefore keep generating capacity and fuel stocks in reserve for supply interruptions — paid for continuously, used occasionally. That reserve is the price of energy security, and it sits on every bill.
A grid with little headroom
Small island networks are usually radial and built around a central power station. Large new connections need reinforcement, and highly variable generation adds a balancing problem to a system that has no neighbour to lean on.
Land that is already spoken for
Ground-mounted solar and onshore wind want the same flat, accessible, coastal land as housing, agriculture and tourism — typically the most valuable land the island has, and the most contested.
Try it
What would an array do for your island?
Set the size of the array and your island’s annual demand. The model returns the share of that demand a NoviOcean array could cover in a representative year, and what it displaces. Both figures below start from illustrative defaults — move them to something closer to your own site.
Illustrative scenario based on representative assumptions. Actual performance depends on location, wave climate, wind, solar irradiation, configuration, load profile and local energy costs. Contact NoviOcean for a site-specific assessment.
The assumptions behind these numbers
| Assumption | Value | Source |
|---|---|---|
| Rated power per unit | 850 kW — 300 wave / 350 wind / 200 solar | Deck slide 6; identical on Technology, Medi Wave 850H, Validation and Simulator modeled |
| Annual production per unit | ~2,500 MWh per year | Deck slide 22 — representative modeled production, not guaranteed for your site modeled |
| Diesel displaced | 400 litres per MWh delivered | Derived from ~1,000,000 litres per 2,500 MWh, deck slide 22 modeled |
| Emissions avoided | ~1 tonne CO₂e per MWh delivered | Derived from ~2,500 t per 2,500 MWh, deck slide 22 modeled |
| NoviOcean energy cost | ~70 €/MWh (~7 c€/kWh) | Conservative end of the Stage A range, 4–8 c€/kWh, deck slide 26 projected |
| Capacity factor | not used | V2 publishes no Medi Wave capacity factor. Annual energy comes straight from the published figure above, never from a capacity factor. estimate |
| Reference island tariff | 15–45 c€/kWh, default 30 | Published tariffs across island territories, deck slide 23 partner |
Demand and price above are illustrative defaults, not your site’s figures, and no local wave, wind, solar or demand data has been used. Output is representative modeled production, not a guarantee.
Island economics
What island power costs today.
This is why islands are the first market rather than the hardest one. Published tariffs in small island systems sit far above mainland European levels — and published tariffs are the friendly number, because they often already contain a subsidy and rarely reflect what an isolated diesel grid actually costs to run.
Representative examples only, not the full list of territories. * subsidized. Published tariffs are quoted per kWh as compiled in the NoviOcean Extended Presentation (slide 23); NoviOcean’s own figure is a Stage A commercial-pilot, unit-level generation cost of approximately 4–8 c€/kWh, excluding site-specific infrastructure such as grid connection, export cabling or local permitting. The two are expressed in different currencies and are indicative, not like-for-like.
- Isolated diesel grids can far exceed published tariffs. In the northern Philippines, generation on isolated island grids has been reported at roughly 45–120 ¢/kWh against a published tariff of about 19 ¢. partner-reported
- The gap matters more than the average: a national tariff describes the system a customer is connected to, not the diesel set that actually runs at the far end of it.
What NoviOcean brings
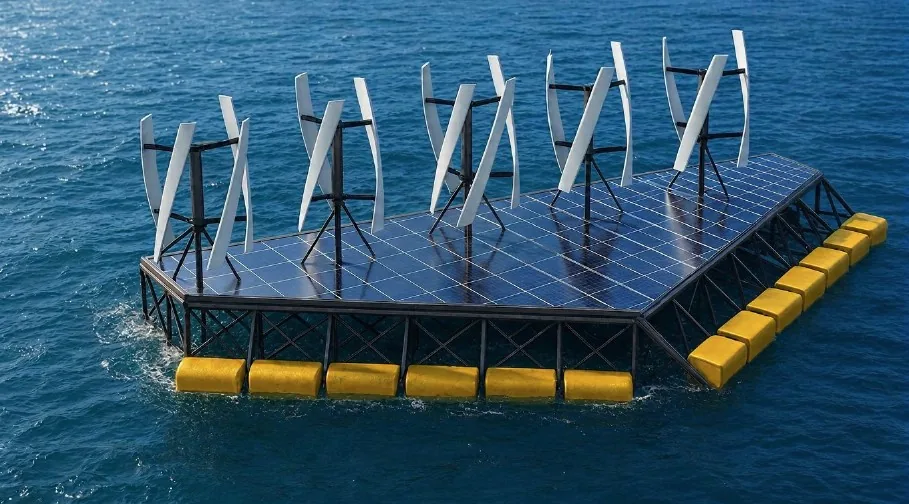
One platform. One mooring. One cable to shore.
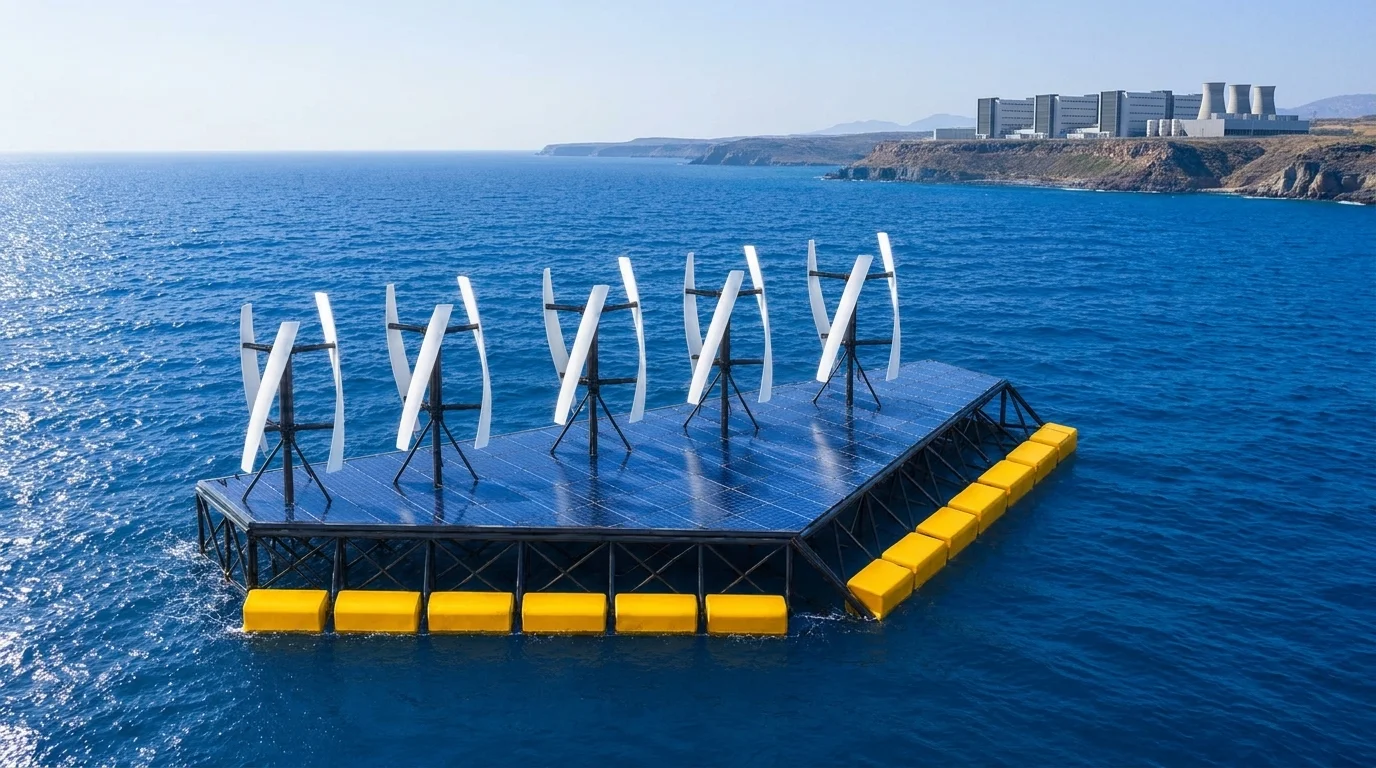
Three generation sources on a single floating structure, sited in the water in front of the community rather than on the land behind it.
One offshore project instead of three
Wave, wind and solar share the same hull, the same anchoring and the same export cable. A unit is rated at 850 kW — 300 kW wave, 350 kW wind and 200 kW solar — so an island permits, installs and maintains one asset rather than commissioning three separate offshore developments. management estimate
Production spread across more hours
The three sources rarely peak together. Wind transfers energy into waves over time and distance, and because water carries so much mass the waves continue after the wind has dropped; solar arrives on a different clock again. Output is therefore spread across more hours of the day and the year than a single-source plant of the same rating. modeled
Less storage and diesel backup — depending on the site
Steadier production narrows the gaps a battery or a generator has to fill. How much backup that actually removes is site- and configuration-dependent: it follows from the local wave climate, wind, irradiation and the shape of the island’s load, and it is settled by a site assessment, not by a brochure.
Nothing built on land
The generation floats. Housing, farmland, tourism and protected ground stay as they are, and the island’s scarcest input is not spent on energy infrastructure.
The yearly effect
What a single unit displaces.
Where a unit replaces diesel generation, these are the three numbers island customers ask about first. They describe one unit in a diesel-displacing application — modelled, not measured at a customer site.
1,000,000 litres
Diesel eliminated, per unit, per year
Fuel that no longer has to be bought, shipped, insured and stored on the island.
modeled~2,500 tonnes
CO₂e avoided annually, per unit
Emissions avoided by the diesel generation the unit replaces.
modeled~2,500 MWh
Electricity produced per unit, per year
Representative modelled production, not a forecast for any particular island.
modeledActual output and savings depend on the site, the load profile and the plant being replaced. The scenario tool shows how the figures move with array size and market, on clearly stated assumptions.
A possible project pathway
From a first unit to an island programme.
Nothing here is a committed project or an agreed commercial model. It is the route most island conversations have taken so far, written down so that a first meeting can start from something concrete.
Step 01
Resource and site review against the diesel baseline
Measured wave, wind and irradiation data for the site; the island’s load through the day and through the year; port access, vessel availability, water depth and seabed for the mooring; and, above all, what the island pays today to generate the energy a platform would displace. The diesel baseline is the number every later decision is measured against.
Step 02
A first unit sized to a defined share of the load
Not the whole island. A defined share, chosen so the existing plant still carries the rest and the community keeps the security it has while the platform proves itself in local conditions. Sizing follows the site review rather than the other way round.
Step 03
Further units as demand and confidence grow
Once the first unit is producing, measured output replaces modelled assumptions, and the island can add units against real numbers — expanding as demand grows, as generators reach the end of their lives, or as the utility decides how far it wants to move away from imported fuel.
Who owns it
Ownership can sit with the utility, with a project company set up for the site, or with a partner that owns and operates the platform and sells the output to the island.
The commercial structures under discussion follow the same order: a project company or special-purpose vehicle for a first site; joint venture, EPC or licensing arrangements as build volume grows; and independent power producer models — including BOOT and BOO — where an island would rather buy energy than own assets. Which of these applies is decided site by site, and none is committed today. management estimate
What island scale would look like
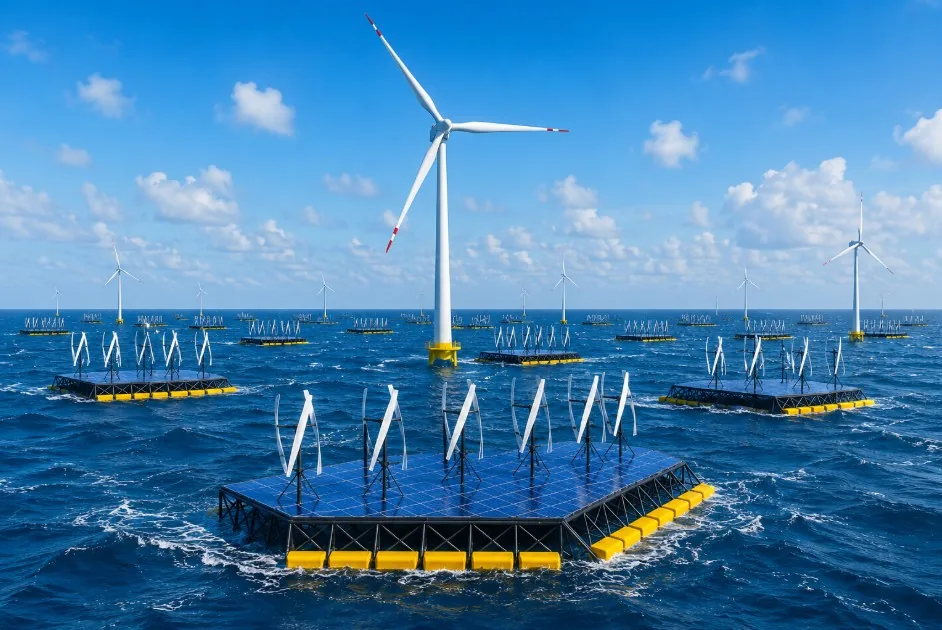
One illustration, to show the size of the opportunity rather than to forecast it: covering half of the Canary Islands’ 2040 renewable-energy goal would correspond to roughly 800 NoviOcean units. management estimate
That figure is an internal illustration of what an island-scale programme implies. It is not a project, a pipeline, a forecast or an agreed target with any authority in the Canary Islands.
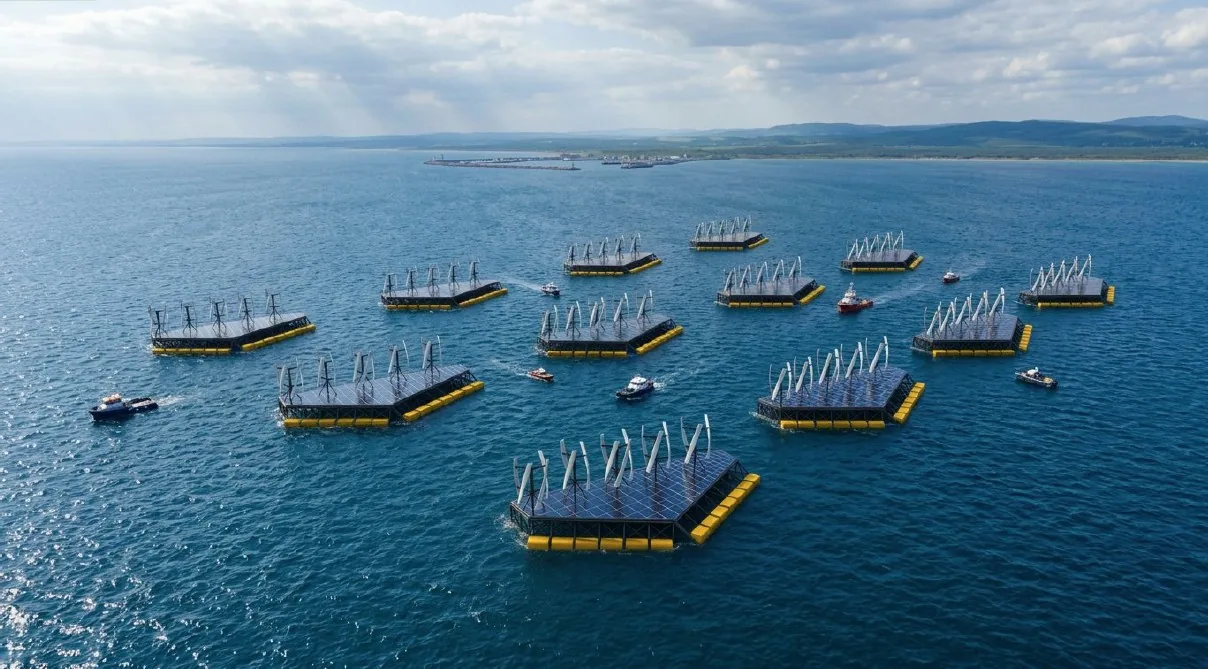
Units added one at a time. One connection ashore.
For illustration only — the actual design is shared in closer dialogues.
Related applications
Often the same island, a second job.
Island projects rarely stay about electricity alone. Freshwater, coastal industry and the wider opportunity set are set out on their own pages.
Tell us about your island.
The annual load, the fuel it burns today and what that fuel costs delivered. With those three numbers we can say honestly whether a NoviOcean unit is a sensible fit for the site — and what it would take to find out properly.