
Company · Investor Relations
Investor and strategic dialogues.
NoviOcean's route to full-scale Medi Wave validation and commercialization is deliberately capital-efficient: one structure, one mooring, one cable and one lease area, carrying wave, wind and solar together. This page sets out what we can say publicly. The rest belongs in a conversation.
The capital-efficient route
Why the same euro goes further here.
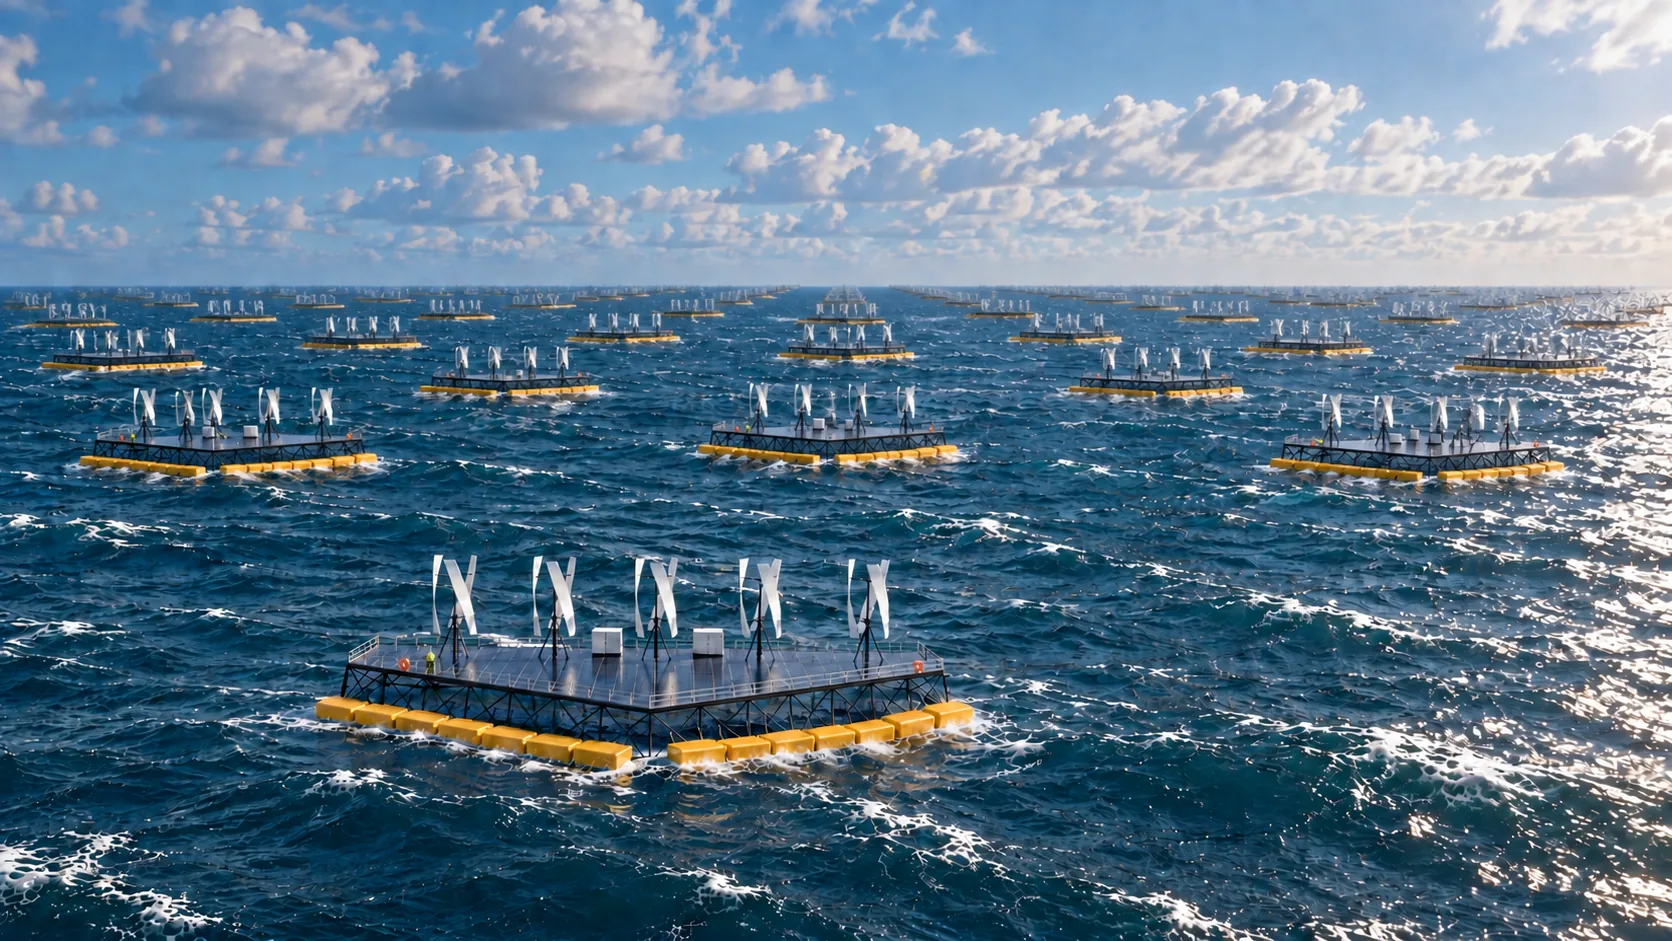
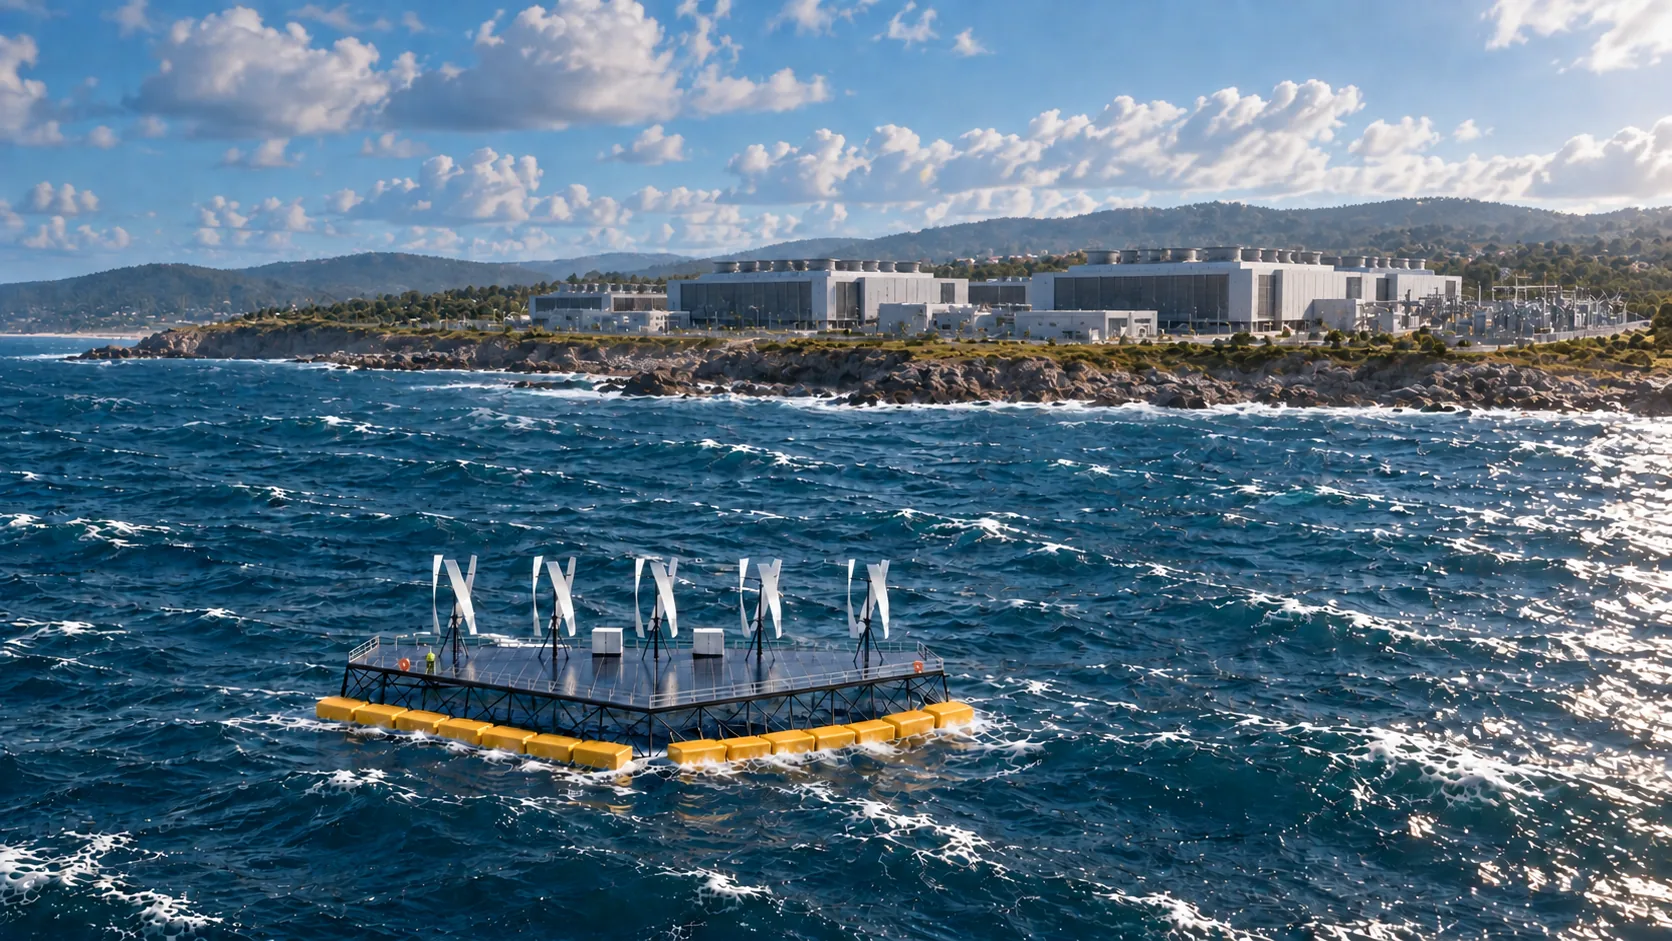
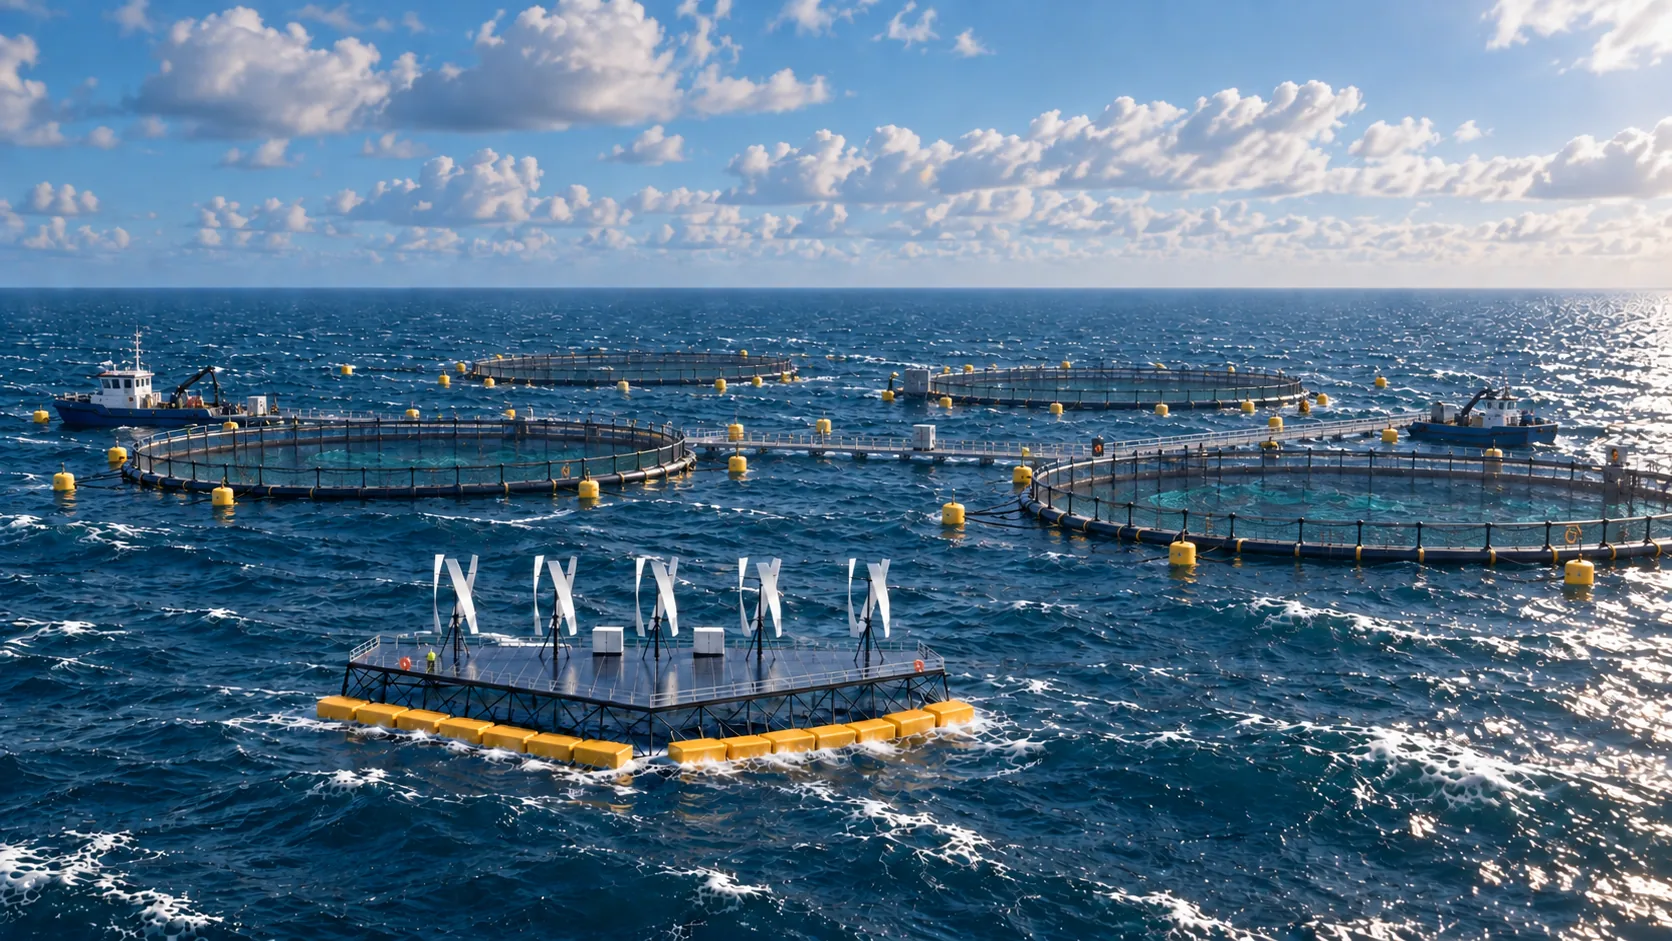
Offshore energy is expensive because every project pays twice: once for the machine, and once for everything that holds it in the sea. NoviOcean pays for that infrastructure once and runs three generation sources across it.
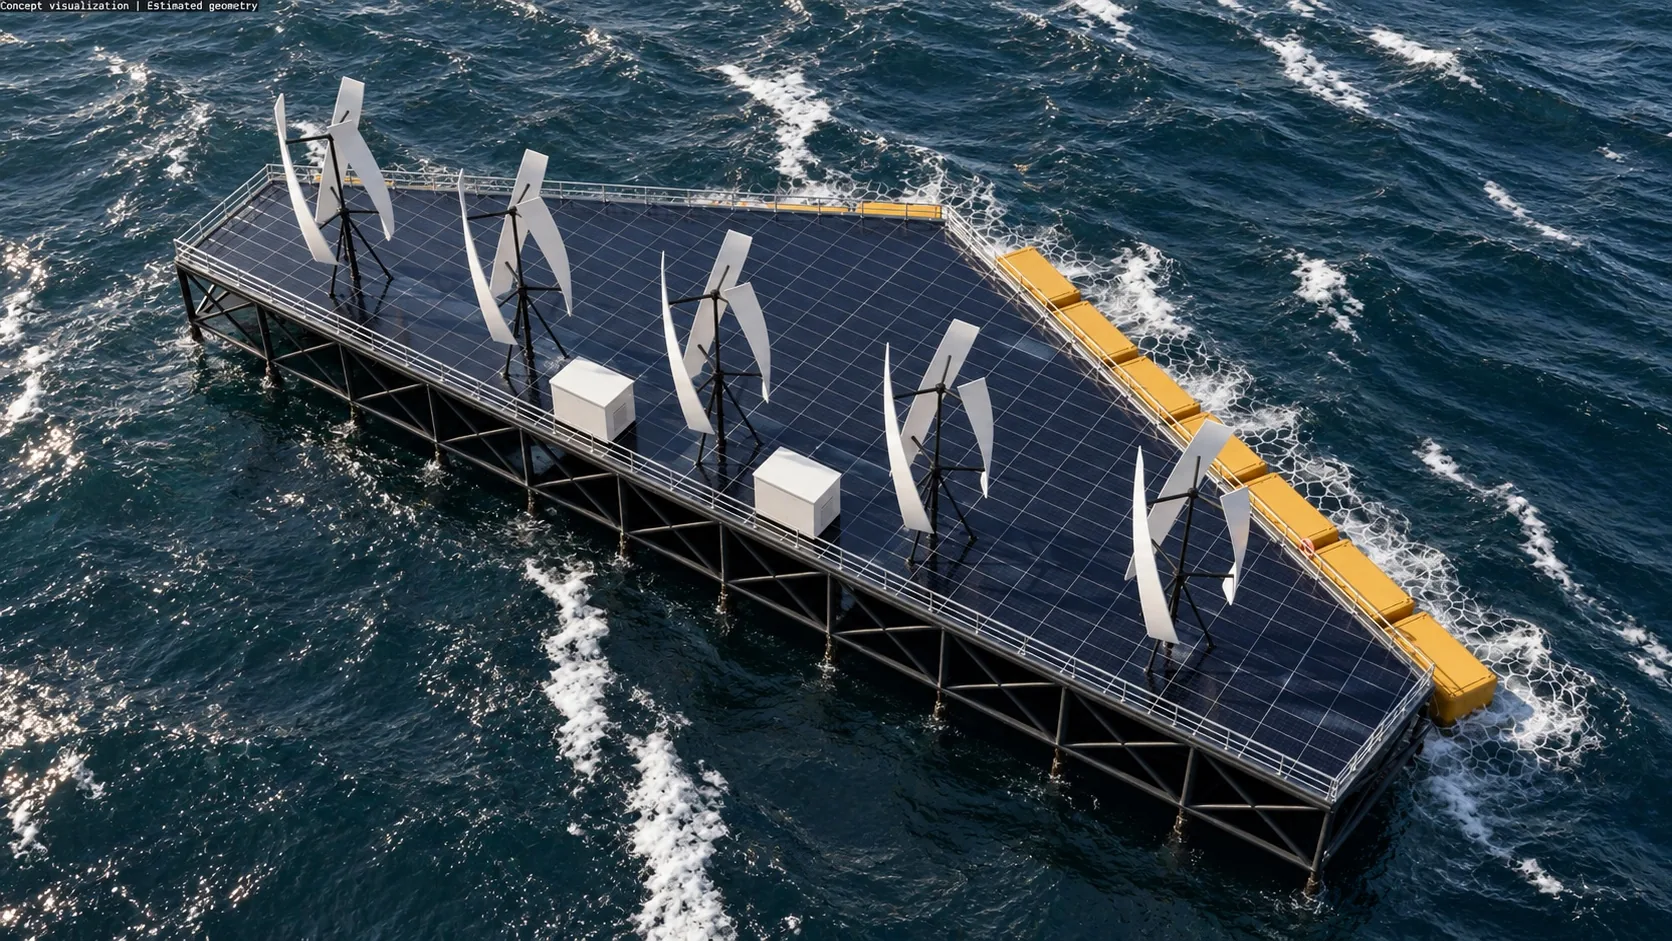
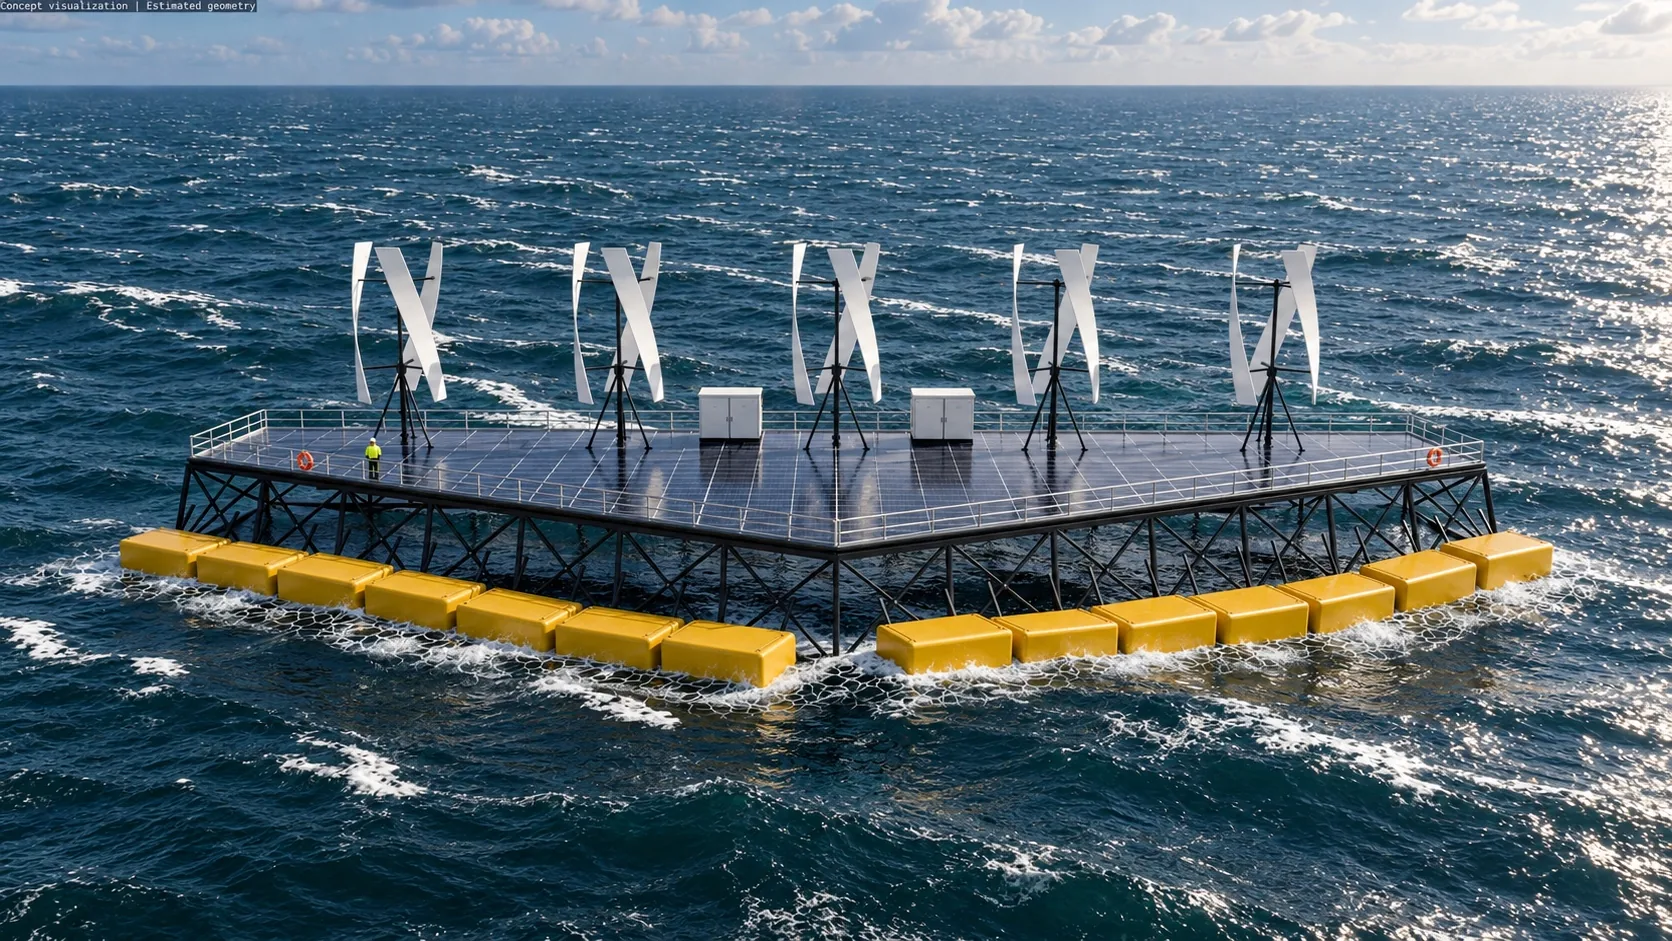
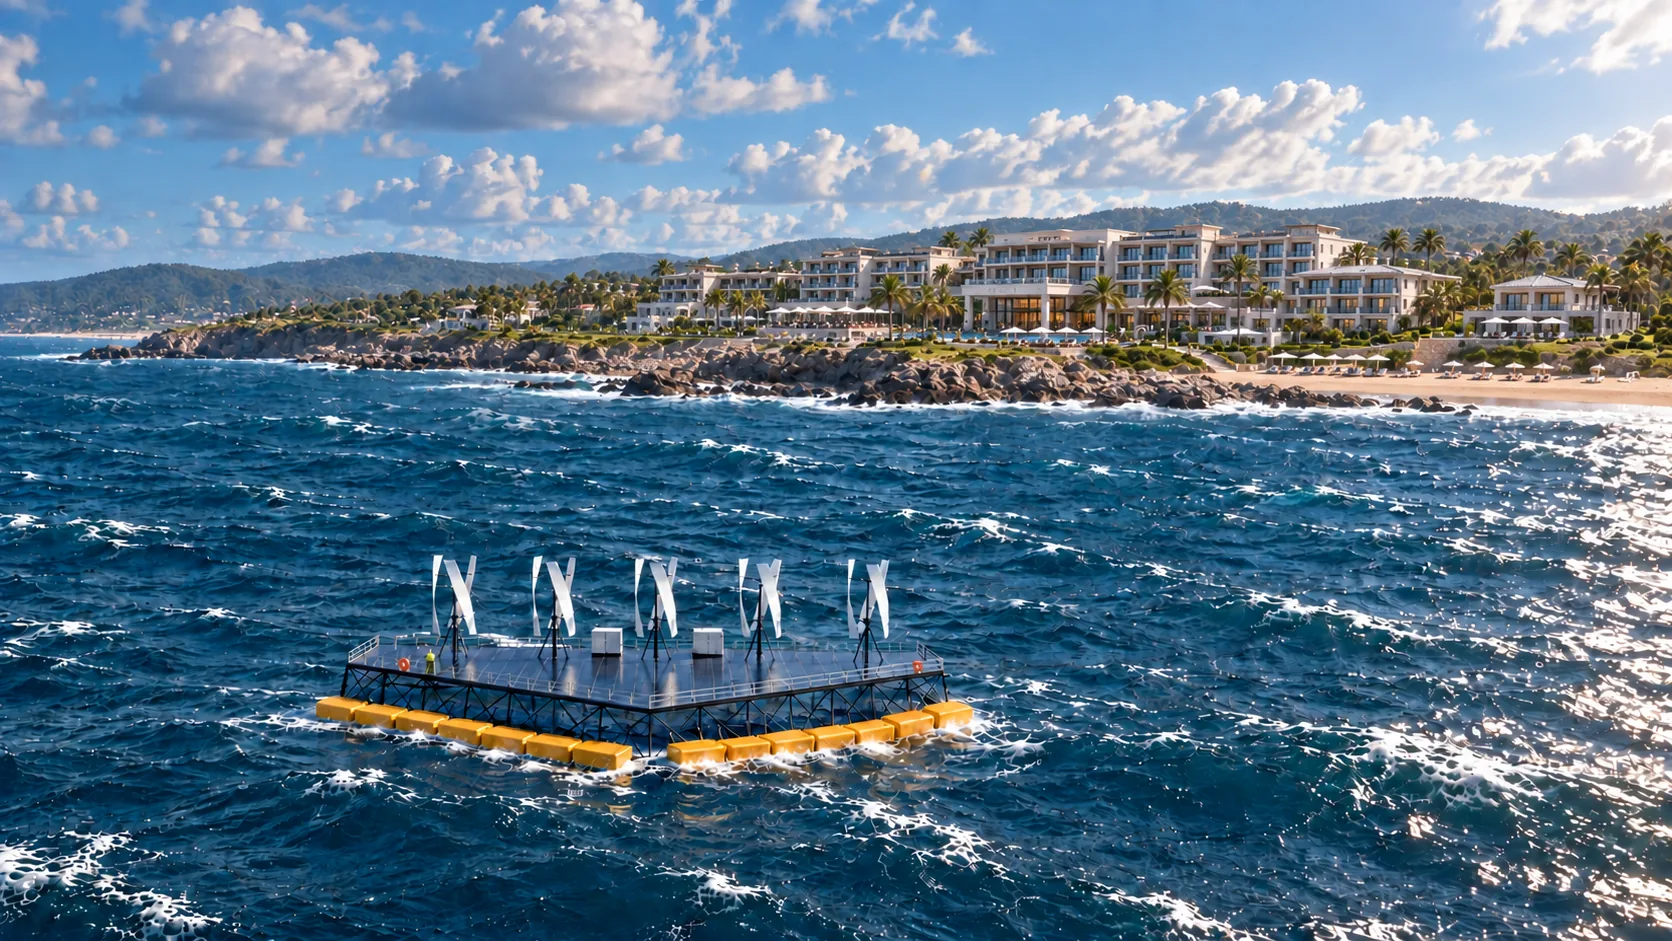
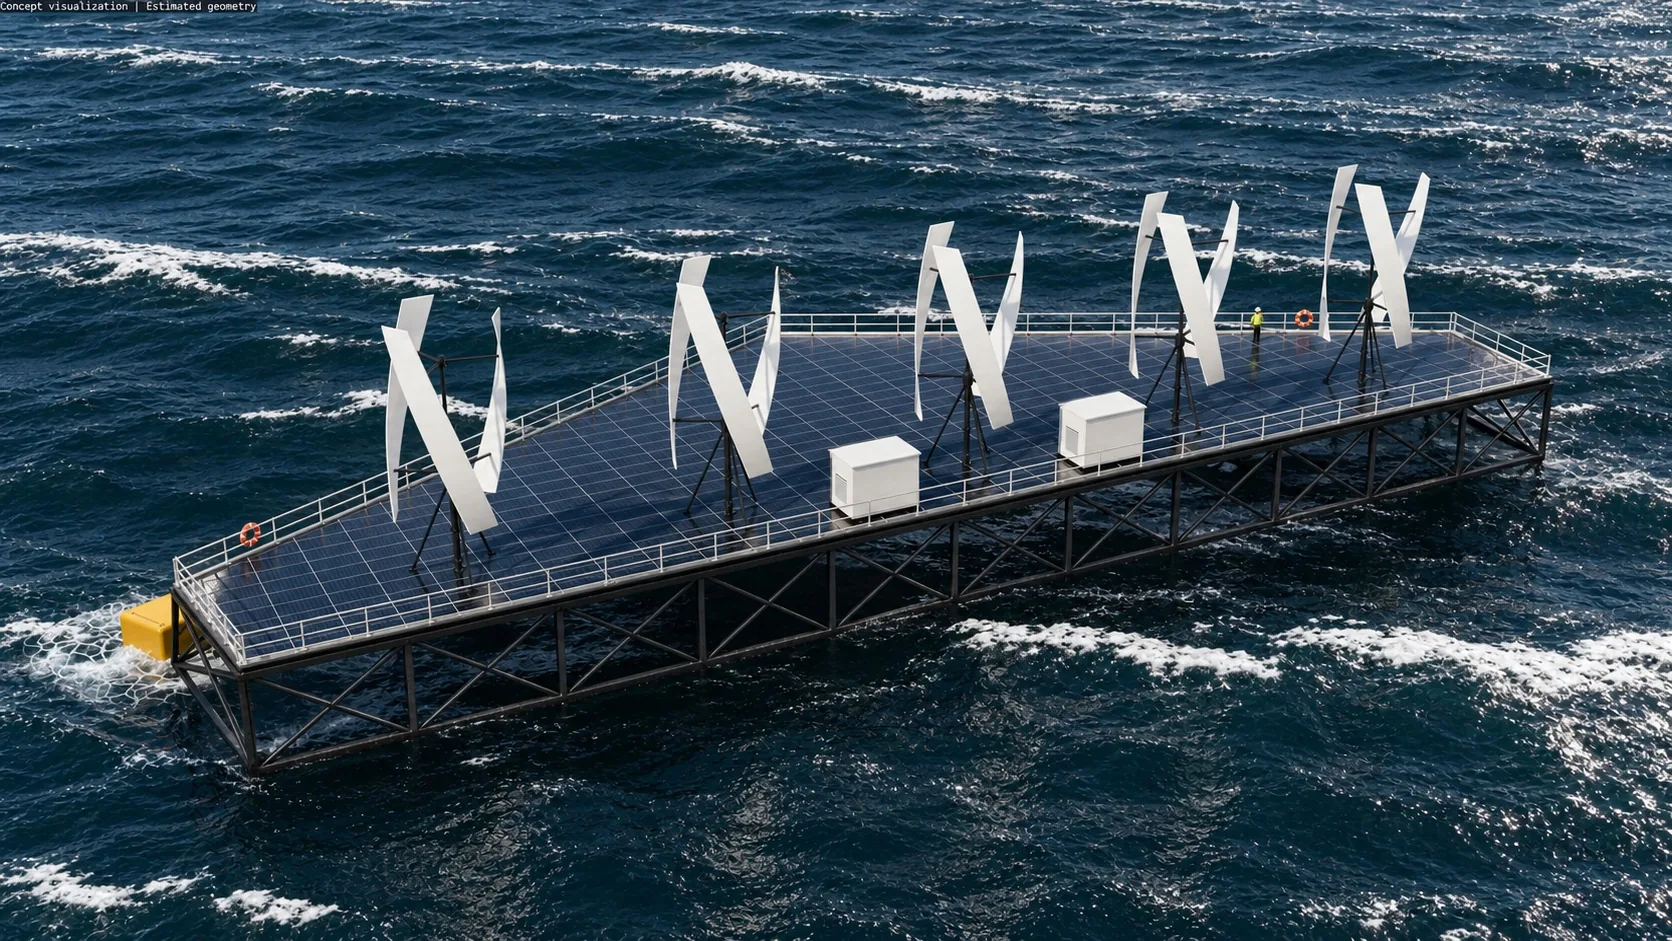
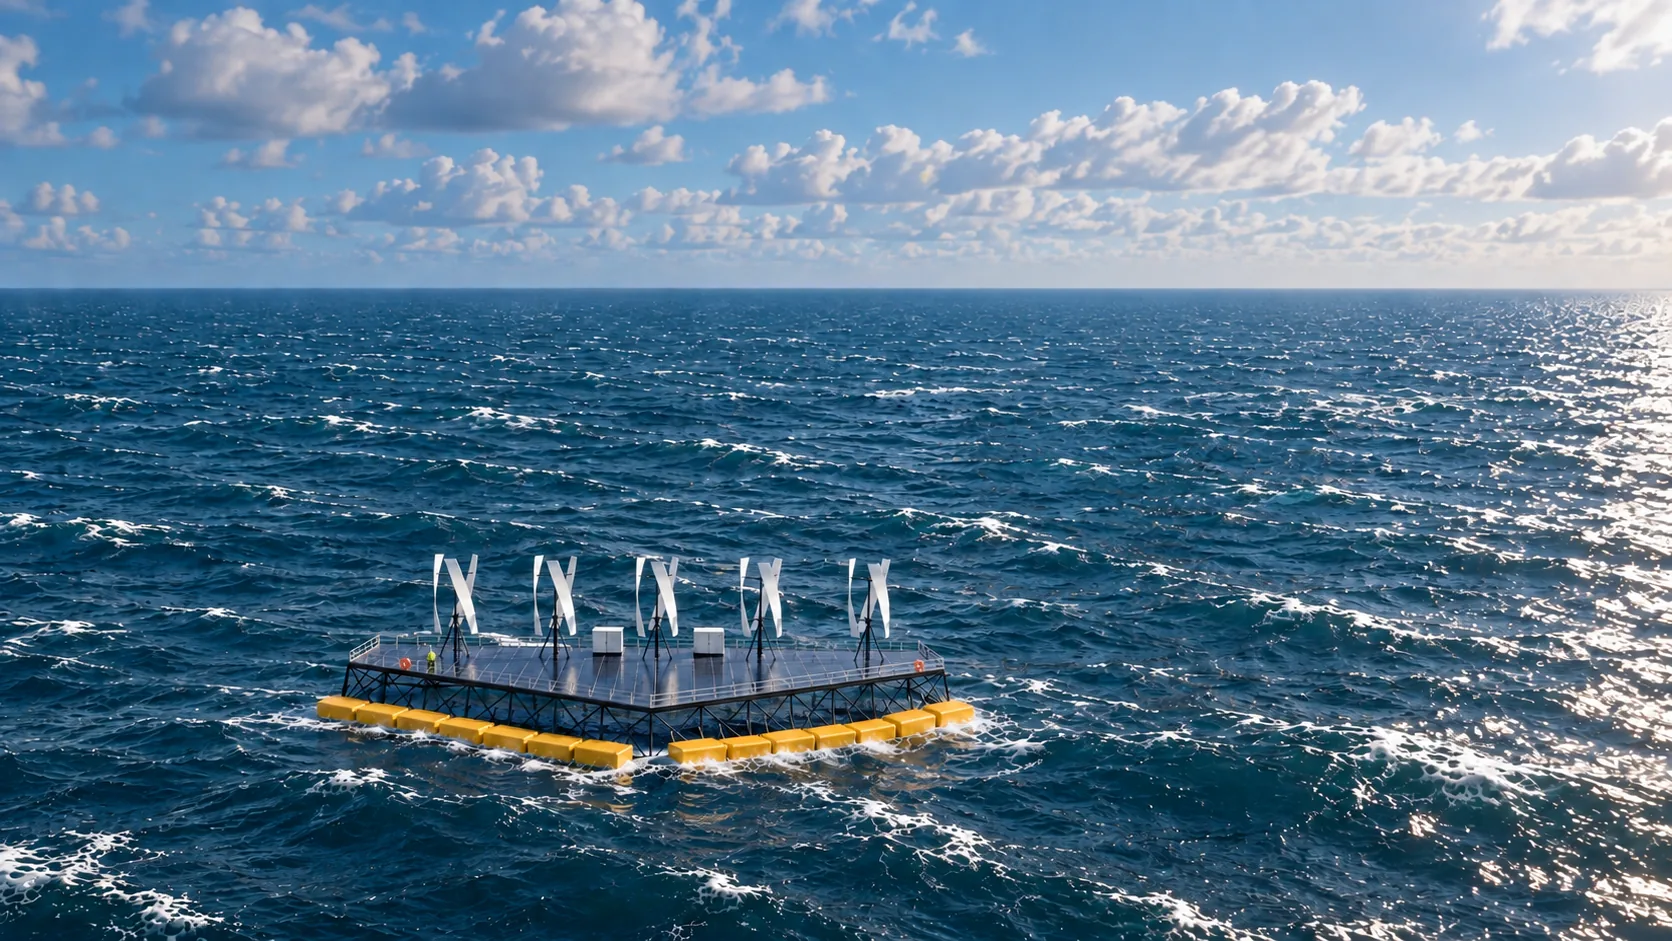
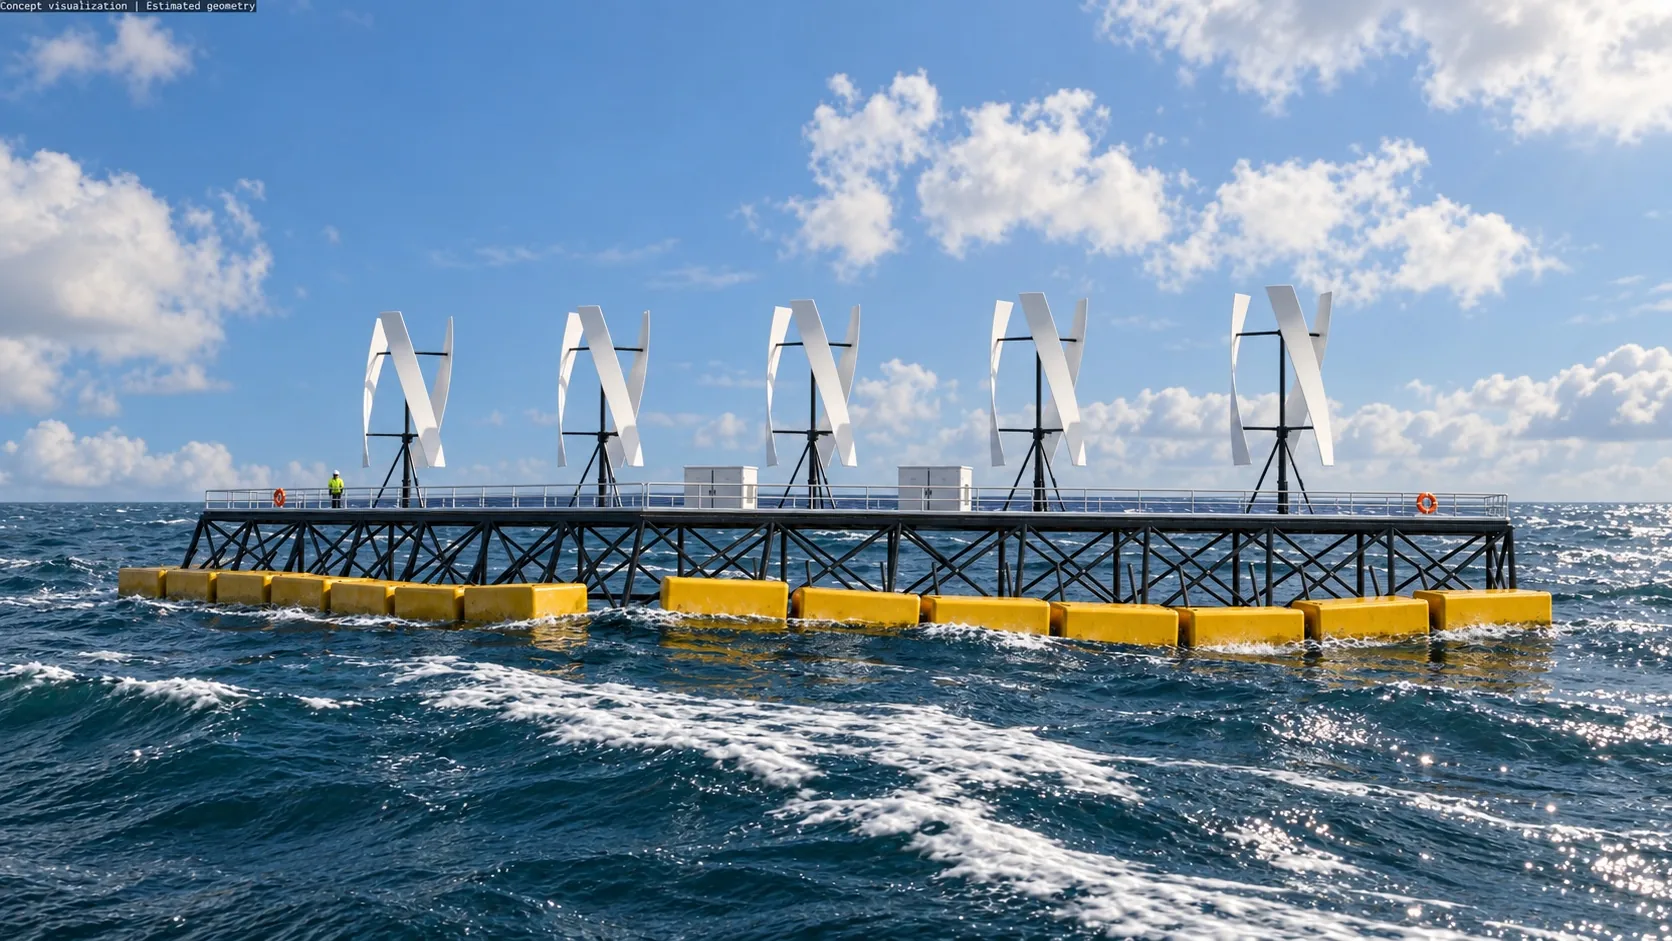
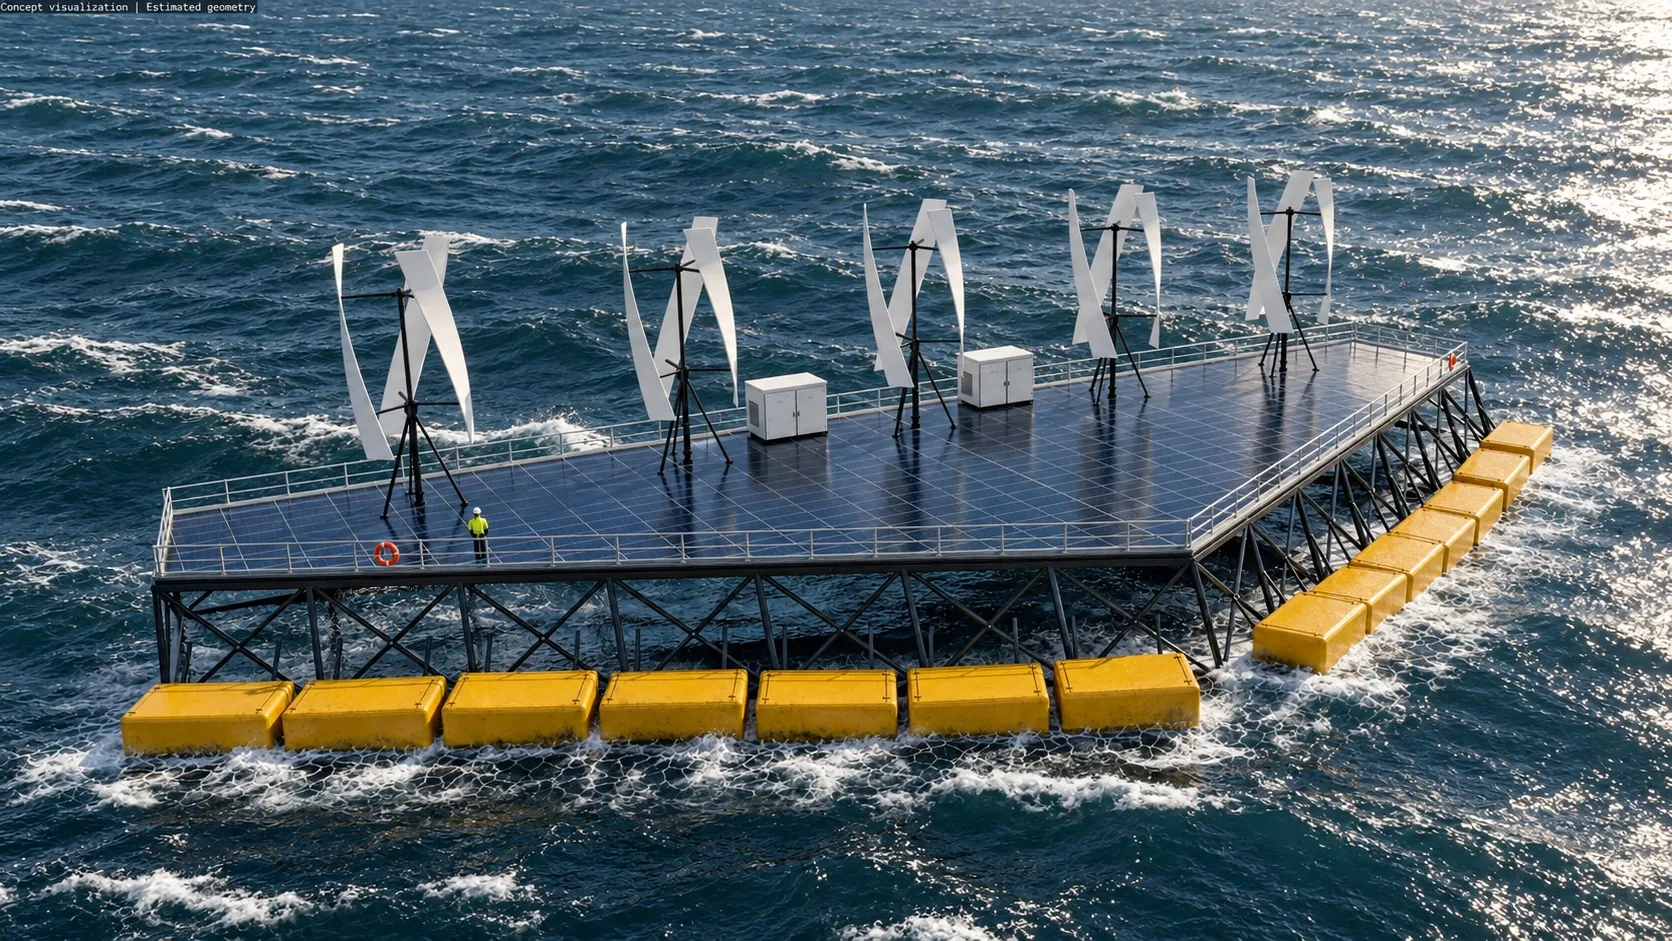
One 850 kW platform carries 300 kW of wave, 350 kW of wind and 200 kW of solar on a single structure and a single mooring. modeled
- Shared infrastructure, three sources. Structure, mooring, cabling and lease area are built and paid for once, then used by wave, wind and solar together.
- About 60% of the weight of fixed-bottom offshore wind per unit of output, and about 30% of the weight of floating offshore wind. Less steel per MWh is less capital per MWh. modeled
- A partner- and grant-funded project model. Public innovation funding, technology partners and host-country stakeholders carry a share of each step, so private capital is not asked to fund the whole development curve alone.
Note Rated capacity is installed nameplate; annual production is modelled and site-dependent. Marine integration and final configuration still require engineering and validation.
Funding
Funding to date, and what the next phase pays for.
Ten years of development, testing and offshore validation have been financed largely by public innovation programmes. The next phase takes Medi Wave from the 2026 triple-hybrid demonstrator to a full-scale customer pilot.
Grants and public funding from EU CINEA–LIFE, the Swedish Energy Agency, Vinnova and others, alongside €0.7M of founder capital from an earlier venture.
measuredInvestor and strategic funding for the full-scale Medi Wave pilot programme with a utility partner — the step from demonstrator to integrated offshore performance validation.
projectedProject financing for commercial arrays, once the pilot has demonstrated integrated offshore performance.
projectedSwipe to see all three phases.
Phase budgets and financing terms are shared in controlled, dated investor material, after an introductory meeting. The technical evidence behind these phases — prototypes, offshore days, tank and rig testing, and what the NO3 demonstrator does and does not validate — is set out on the Validation page.
Customer economics
What the customer pays, stage by stage.
Five deployment stages, from the first full-scale unit to a thousand. Early units lean on public support; later units lean on the learning curve. For the customer, the cost of energy stays in a narrow band and then falls.
Commercial Pilot
Unit #1
High public support; offshore validation; first full-scale system in water.
~4–8 c€/kWh
Early Rollout
2–50 units
Reduced grants; learning curve active; replicated core configuration.
4–8 c€/kWh
Industrialization
50–100 units
Standardized builds; scale effects; supply-chain optimization.
4–8 c€/kWh
Market-Driven Expansion
100–200 units
Limited grants; learning offsets remaining support.
3–6 c€/kWh
Fully Commercial Scale
200–1,000 units
Minimal subsidies; larger batch orders; pure market economics.
2–5 c€/kWh
LCOE figures refer to unit-level generation cost (excluding site-specific infrastructure such as grid connection, export cabling or local permitting). Index values are relative, with the first unit's system cost set to 1.00.
The learning curve
Cost per MWh keeps falling as units are built.
The platform is a repeatable, shipyard-built product rather than a bespoke marine project. Each doubling of cumulative units takes cost out, and the starting point depends on how much wave, wind and sun a site actually has.
Assumes 12% cost reduction per doubling of cumulative units. Baselines: 250 kW €166/MWh; 350 kW €119/MWh; 450 kW €92/MWh.
Where this sits
Stable energy without the cost of storage or nuclear.
Cheap generation alone is not what a grid or an island buys — it buys power that is there when it is needed. Wave, wind and solar peak at different times, so the hybrid platform delivers steadier output than any of the three alone, without paying for a large storage fleet.
Position based on engineering design, system modelling, and offshore test results.
Market size
Ocean energy is a market with a published trajectory.
The total market comes from IRENA's 2050 deployment outlook and the European Commission's Fit-for-55 target. NoviOcean's obtainable share is the company's own planning figure, and is labelled as such.
Circle areas are illustrative and not drawn to scale. Sources named on the chart; the obtainable share is NoviOcean's own planning assumption.
| Market tier | Early addressable market, 2030 | Total market, 2050 |
|---|---|---|
| Total Addressable Market | 50 GW : €120 Billion contracted by 2030 | 350 GW : €1,225 Billion deployed ocean energy globally (IRENA) — of which 40 GW : €140 Bn in Europe (European Commission Fit-for-55 target) |
| Serviceable Addressable Market | 20 GW : €50 Billion contracted by 2030 | 250 GW : €875 Billion worldwide |
| Serviceable Obtainable Market | 50 MW : €150 Million contracted by 2030 | 40 GW : €100 Billion deployed — 25% of the European market and 10% outside Europe |
Worked example: covering half of the Canary Islands' 2040 renewable-energy goal would mean roughly 800 units and about €1.6 Bn in sales; adding the Arabian Sea, Indian Ocean and Philippine Sea raises indicative demand by around 20,000 units, or about €40 Bn. management estimate
The road ahead
Target unit sizes as the platform scales.
Medi Wave 850H is the current product and the pilot pathway. The same architecture — one structure, one mooring, three sources — is designed to scale to larger units as arrays are built. projected
Target unit sizes, not committed products. Each step depends on the results of the phase before it. See the Medi Wave 850H platform.
Traction
Where the first projects are being discussed.
Stated precisely, and no further. Each of these is an early-stage commercial conversation, not a signed construction contract.
MOU signed with MIR Green Energy
A memorandum of understanding signed with MIR Green Energy for pilot project development in Costa Rica.
management estimateMOU under evaluation
An MOU is under evaluation with a national energy stakeholder, alongside discussions with utilities and government entities.
management estimateStrategic partner in discussion
Structured discussions with a strategic partner toward a planned pilot deployment.
management estimateInterest is broader than these three — utilities, island communities, ports, offshore wind developers, research institutions and governments — but nothing is described here as further advanced than it is. See the application routes.
Request the investor package.
Detailed benchmarking, phase budgets, valuation and financing terms are shared in controlled, dated investor material after an introductory meeting.
The reason is discipline, not secrecy. Those documents are versioned and dated, they move as the programme moves, and an out-of-date figure on a public page helps nobody. Everything on this page is what we can stand behind publicly, with its evidence label attached.
- Open on this site. The platform and its technology ecosystem, the development journey and what the current demonstrator does and does not validate, the funding history, the patent position, and the market and cost framing above.
- In the investor package. The benchmarking study, phase budgets, financing terms, site-specific yield modelling and the detailed design of the wave power take-off.
- Every figure carries its evidence label — measured, modeled, projected or management estimate — in the package exactly as it does on this page, so you always know what kind of number you are reading.
Investor questions
The questions we get asked first.
What does the €8.2M next phase actually pay for?
The step from the 2026 triple-hybrid demonstrator to a full-scale Medi Wave pilot with a utility partner, planned for 2027–2028. That pilot is what produces integrated offshore performance data at full scale. projected
Phase budgets and the financing terms behind that figure sit in the dated investor material, not on a public page.
Does the funding history prove the technology works?
No, and we will not present it that way. Capital raised establishes nothing about output, cost of energy or profitability. That applies to every company in this sector, including this one.
What the funding history does show is that public innovation bodies assessed the work at successive stages and continued to back it. Treat that as diligence by others, not as performance.
Is a full-scale unit already operating offshore?
No. The current stage is the NO3 triple-hybrid demonstrator, which validates hydrodynamic behaviour, structural response, mooring performance and the correlation between offshore measurements and the simulation model.
It does not validate the full power train, the Pelton system, the wind system, the solar system or commercial energy production. The full-scale Medi Wave pilot is the next major phase. The complete scope statement is on the Validation page.
Where does the cost advantage come from?
From sharing one set of offshore infrastructure between three generation sources, and from building a repeatable product rather than a bespoke marine project. The learning curve above assumes a 12% cost reduction per doubling of cumulative units. modeled
It is a model, not a result. What has been measured so far is prototype and offshore-demonstrator behaviour, not commercial production cost.
What does a 50-year financial lifetime mean?
It is the design target used in the company's financial modelling, and it is written as a target because it has not been demonstrated. Nothing offshore has run for fifty years to prove it. management estimate
A long structural life also does not make the later years free. Replacements, overhauls, corrosion management and the cost of financing all have to be modelled, and the components inside the platform have shorter reference lives than the steel around them.
What is on this page, and what is in the investor package?
On this page: the capital-efficiency argument, the funding history and next phase, customer cost by deployment stage, the learning curve, market sizing and early commercial traction — each with its evidence label.
In the package: benchmarking, phase budgets, financing terms, site-specific yield modelling and the detailed design of the wave power take-off. It is shared after an introductory meeting, as controlled, dated material.
Investor Relations is part of Company — where the team, the board and advisers, the partners behind the technology ecosystem and the general contact details all sit.
Start with a conversation, not a data room.
Thirty minutes with Jan Skjoldhammer covers the programme, the next phase and what the investor package contains. The material follows the meeting.