
Interactive simulator
What could NoviOcean do for your site?
Validation answers why you should believe NoviOcean. This tool answers what NoviOcean might do for you. Pick a market, set the array size, and see indicative production, demand coverage, emissions reduction, diesel displacement and potential savings.
Please read before you use this tool
Illustrative scenario based on representative assumptions. Actual performance depends on location, wave climate, wind, solar irradiation, configuration, load profile and local energy costs. Contact NoviOcean for a site-specific assessment.
Scenario builder
Build a scenario.
Choose the market you are buying energy for, then choose how many Medi Wave 850H units you would deploy. The console models a full year of that array: representative modeled production, how much of a typical demand it would cover, the emissions and diesel it would displace, and an indicative energy-cost effect. modeled
Nothing here is tuned to a particular place. There is no location field and no map, because no site data have been analysed — every result is a scenario built on the assumptions listed underneath the console. When you want numbers for a real site, that is a site-specific assessment, and it starts with a conversation.
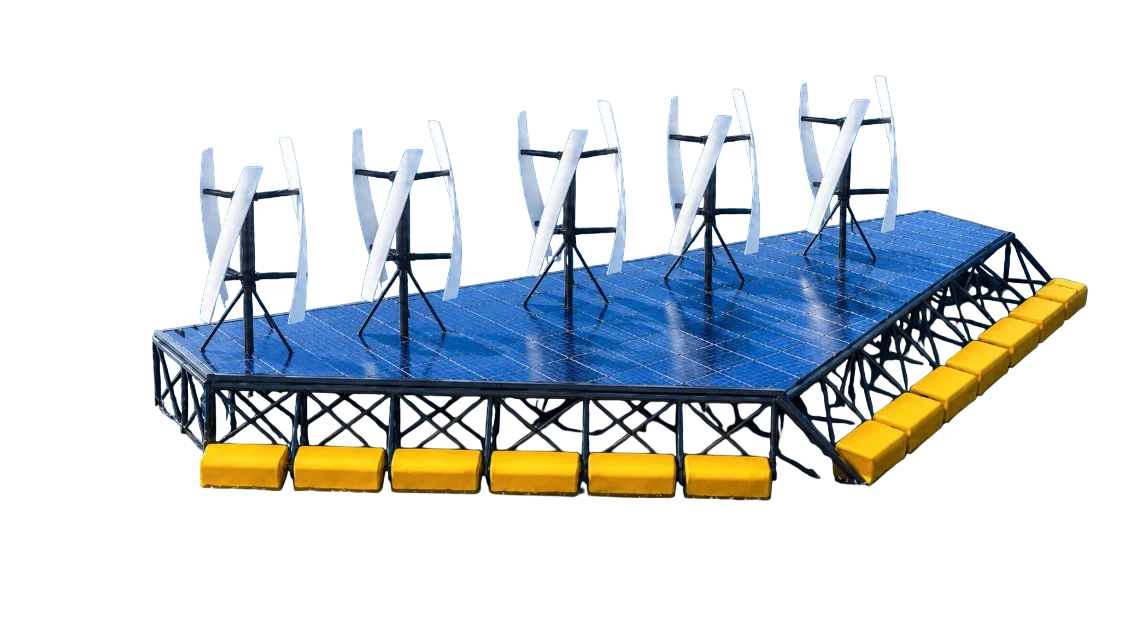
Platform illustration only — the actual design is shared in closer dialogues.
1. Choose a sector
One platform, many markets. Pick the one you are buying energy for. Each sector arrives with an illustrative annual demand and a reference energy price — representative planning examples, not your figures.
2. Size the array
One Medi Wave 850H is rated at 850 kW — 300 kW wave, 350 kW wind, 200 kW solar.
3. Scenario results Remote Islands
Annual output below is representative modeled production for a Medi Wave 850H array — not guaranteed production for your location. Annual demand and the reference energy price are illustrative defaults supplied with the sector, not values you entered. modeled
Illustrative scenario based on representative assumptions. Actual performance depends on location, wave climate, wind, solar irradiation, configuration, load profile and local energy costs. Contact NoviOcean for a site-specific assessment.
Energy mix — one unit
- Wave 300 kWinverted hydro power plant
- Wind 350 kWvertical axis · Wind Harvest
- Solar 200 kWflexible CIGS · Midsummer
Production across the year illustrative seasonal shape — wave, wind and solar peak at different times
Demand versus modeled production
GWh per year
Performance
Choose a sector above to run a scenario.
Assumptions, units and sources behind every number above
These are all of the inputs the model uses. Nothing else feeds it — there is no site data, no measured resource and no live feed behind these results.
| Input | Value | Unit | Source | Evidence |
|---|---|---|---|---|
| Rated power, Medi Wave 850H | 850 | kW | NoviOcean design basis, Extended Presentation 2026 — identical on Technology, Medi Wave 850H and Validation | management estimate |
| Rated split | 300 wave · 350 wind · 200 solar | kW | NoviOcean wave system; Wind Harvest vertical-axis turbines; Midsummer CIGS solar | management estimate partner-reported |
| Established-technology share of rated capacity | 65 | % | Arithmetic: (350 wind + 200 solar) ÷ 850 rated | management estimate |
| Annual production per unit | ~2,500 | MWh per unit per year | NoviOcean published per-unit figure for a representative site. This is the model’s energy input — every production, emissions, diesel and cost figure scales from it | modeled |
| Capacity factor | not used | — | The model takes annual production directly and does not apply a capacity factor. NoviOcean publishes no Medi Wave capacity factor, because no agreed source exists — see the review note below the table | management estimate |
| Diesel displaced per unit | ~1,000,000 | litres per unit per year | NoviOcean published per-unit figure; the tool scales it at ~400 litres per MWh displaced | modeled |
| Avoided emissions per unit | ~2,500 | tonnes CO₂e per unit per year | NoviOcean published per-unit figure; the tool scales it at ~1.0 t CO₂e per MWh displaced | modeled |
| NoviOcean reference energy cost | 7 — the conservative end of a stage-A range of ~4–8 | c€/kWh (€70/MWh) | Stage A, commercial pilot. Unit-level generation cost, excluding site-specific infrastructure such as grid connection, export cabling or local permitting. The figure falls with deployment — see Investor Relations | projected |
| Sector annual demand | 5 – 55, depending on sector | GWh per year | Representative planning examples supplied as defaults with each sector. They are not values entered by the visitor and not tied to any real customer | management estimate |
| Reference energy price by sector | 14 – 30, depending on sector | c€/kWh | Illustrative defaults drawn from published market pricing tiers — island territories commonly sit between 20 and 40 c€/kWh. Not a quotation and not a local tariff lookup | management estimate |
| Monthly production shape | illustrative profiles | share of the annual total | Seasonal shapes showing that wave, wind and solar peak at different times of year. The annual total carries the message, not the monthly curve | management estimate |
| Deployable water depth | 20 – 200 | m | NoviOcean design envelope for the moored platform | management estimate |
This tool is a scenario model for discussion. Site-specific yield depends on wave climate, wind resource, irradiation, depth, load profile and grid connection — real projects are sized with measured site data, which this tool does not have. See how the model itself was built and checked →
Scope
What this tool is — and what it is not.
Being clear about the limits is what makes the numbers useful. The console is built to show the shape of an outcome, quickly, so that a first conversation can start from something concrete.
What this tool is
- An illustrative scenario model
- Built on representative assumptions, all of them listed above
- A way to see the shape of an outcome across markets and array sizes
- A starting point for a conversation
What this tool is not
- A site-specific forecast
- Based on your location’s measured wave, wind or solar resource
- A guarantee of production or savings
- A commercial offer
The evidence behind the model — testing, offshore operation and model validation →
Ready for numbers built on your site?
A site-specific assessment replaces every default above with measured wave, wind and irradiation data for your location, your load profile and your local energy costs. That is the conversation this tool is meant to start.